• Skip to primary navigation
  • Skip to main content
  • Skip to primary sidebar
  • Skip to footer
  • About TronWeekly
  • Write for us
  • Terms and Conditions
  • Privacy Policy
  • Disclaimer
  • Contact
  • All Posts
  • Advertise

TronWeekly

Crypto World News

  • Home
  • Latest News
  • Opinion
    • Education
    • Best TRON Wallets
    • Beginner’s guide to TRON
    • Tron Tokens
    • Market Analysis
  • Industry
    • Tron Exchange
    • Project Review
  • Press Release
  • Bitcoin (BTC)
  • Ripple (XRP)
  • Advertise
  • About TronWeekly
    • The Team
    • Editorial Policy
    • Write for us
    • Privacy Policy
    • Disclaimer
    • Terms and Conditions
    • Contact
You are here: Home / All Posts

All Posts

XRP Price Breakout Above $1.56 Could Trigger Strong Upside Rally Move

By Bena Ilyas | Edited By Ammar Raza,May 16, 2026, 5:00 PM

XRP price has experienced a temporary pullback while still trading in a consolidation range, amid market indecision. Despite recent weakness, network activity is increasing after an initial short-lived upside move in the previous week.

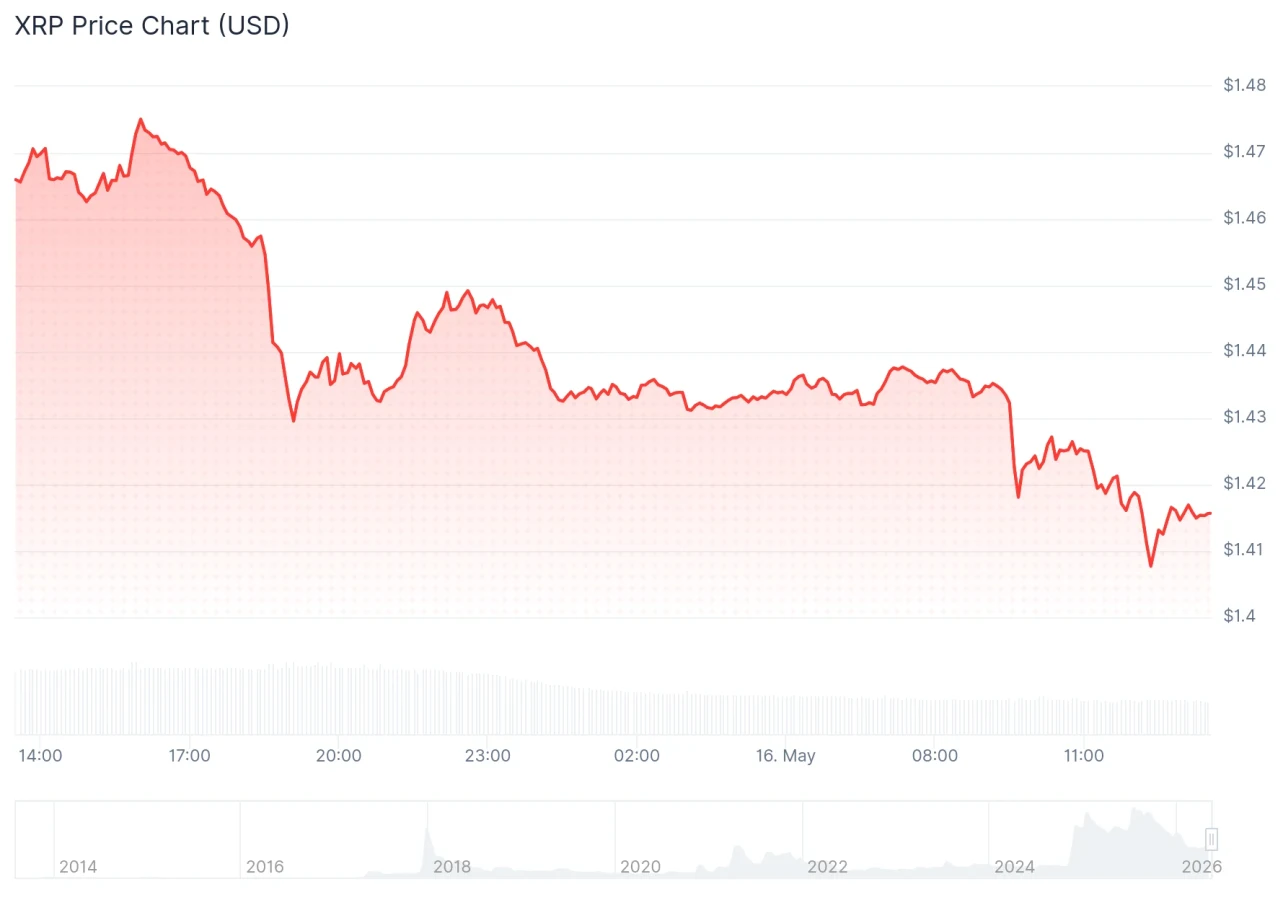
Currently, XRP is trading around $1.42, reflecting a 3.36% decline over the past 24 hours. The asset had a trading volume of $3.03 billion, a market cap of $87.50 billion, and a market dominance of 3.34%. Despite experiencing a temporary pullback, recent on-chain activities show a significant surge in network activity after a temporary price break above $1.54.

XRP price chart
Source: CoinGecko

Also Read | Dogecoin Price Could Rebound Toward $0.15 if Buyers Regain Momentum

XRP Price Saw Breakout Above $1.54 Level

According to the latest intelligence report from Santiment, there was a notable boost in XRP network activity after the crypto asset broke out of the $1.54 mark. It shows that there were about 48,453 active addresses within a day, which was the highest in four months since March 30. 

XRP price analysis
Source: Santment’s X Post

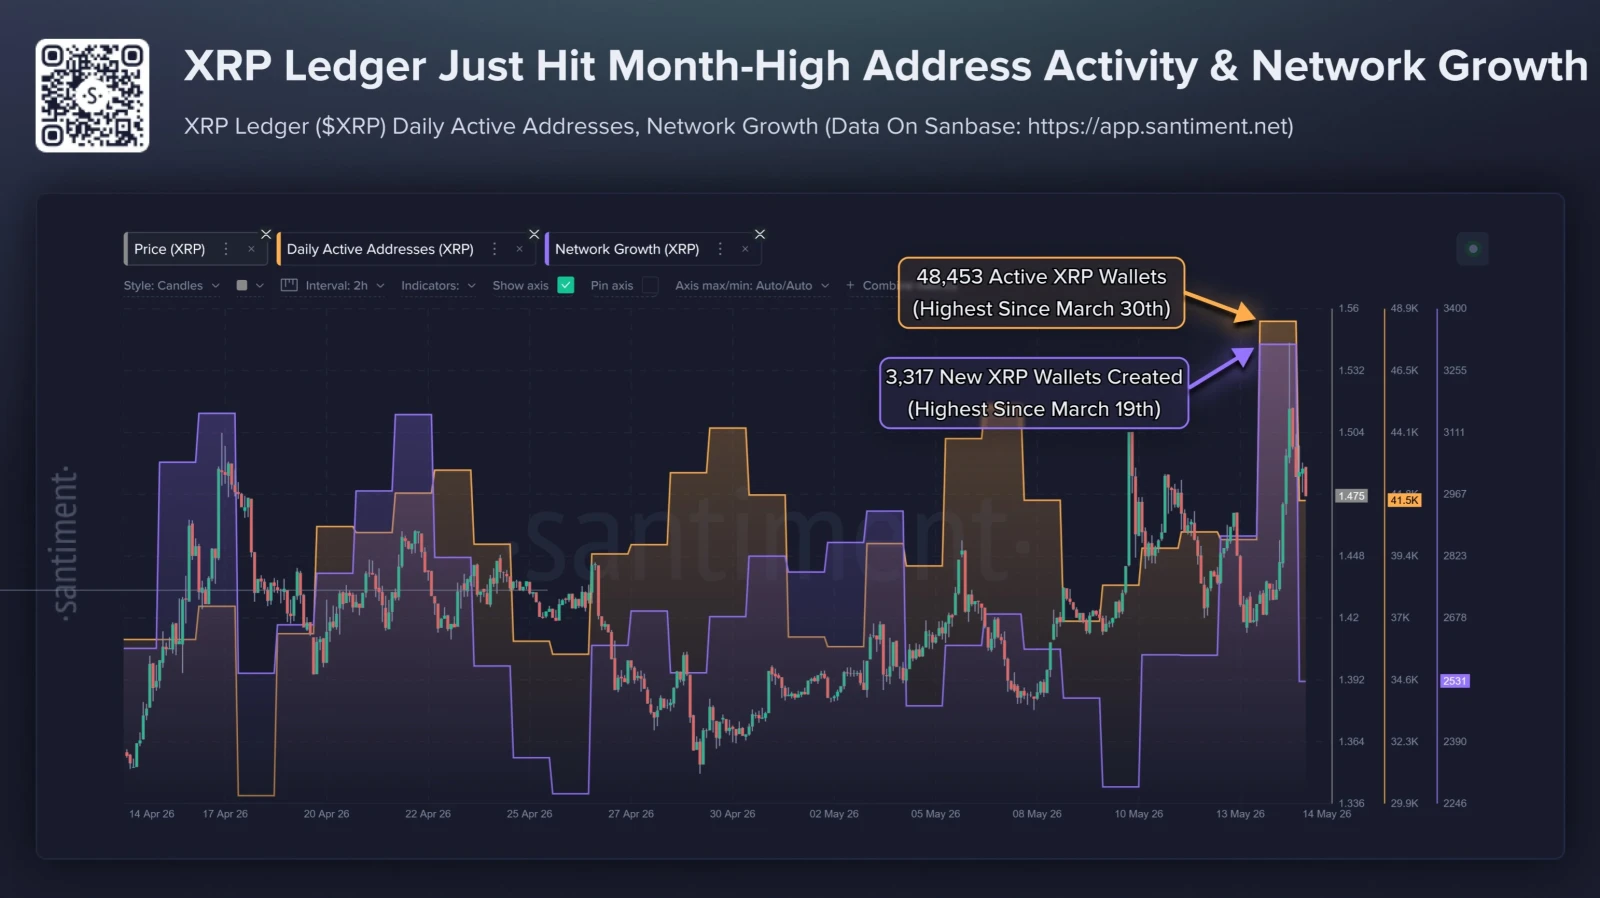
In addition, there were 3,317 new addresses, which showed strong network activity since March 19. These surges indicate higher engagement with the XRP ledger during the recent price expansion phase. Most of these rises are associated with increased interest during the rally, where many users engage with the network. 

While short-term price rallies might be driven by short-lived hype, higher transaction volumes are seen to support long-term value creation, due to greater blockchain usage.

XRP Support Breakdown Risks Further Decline

Based on technical analysis, XRP has been moving sideways for about five weeks. The asset is contained between a $1.3671 support level and a $1.5625 resistance level, creating a tight range. This setup shows a neutral phase, where neither buyers nor sellers have taken full control.

XRP technical price analysis
Source: TradingView

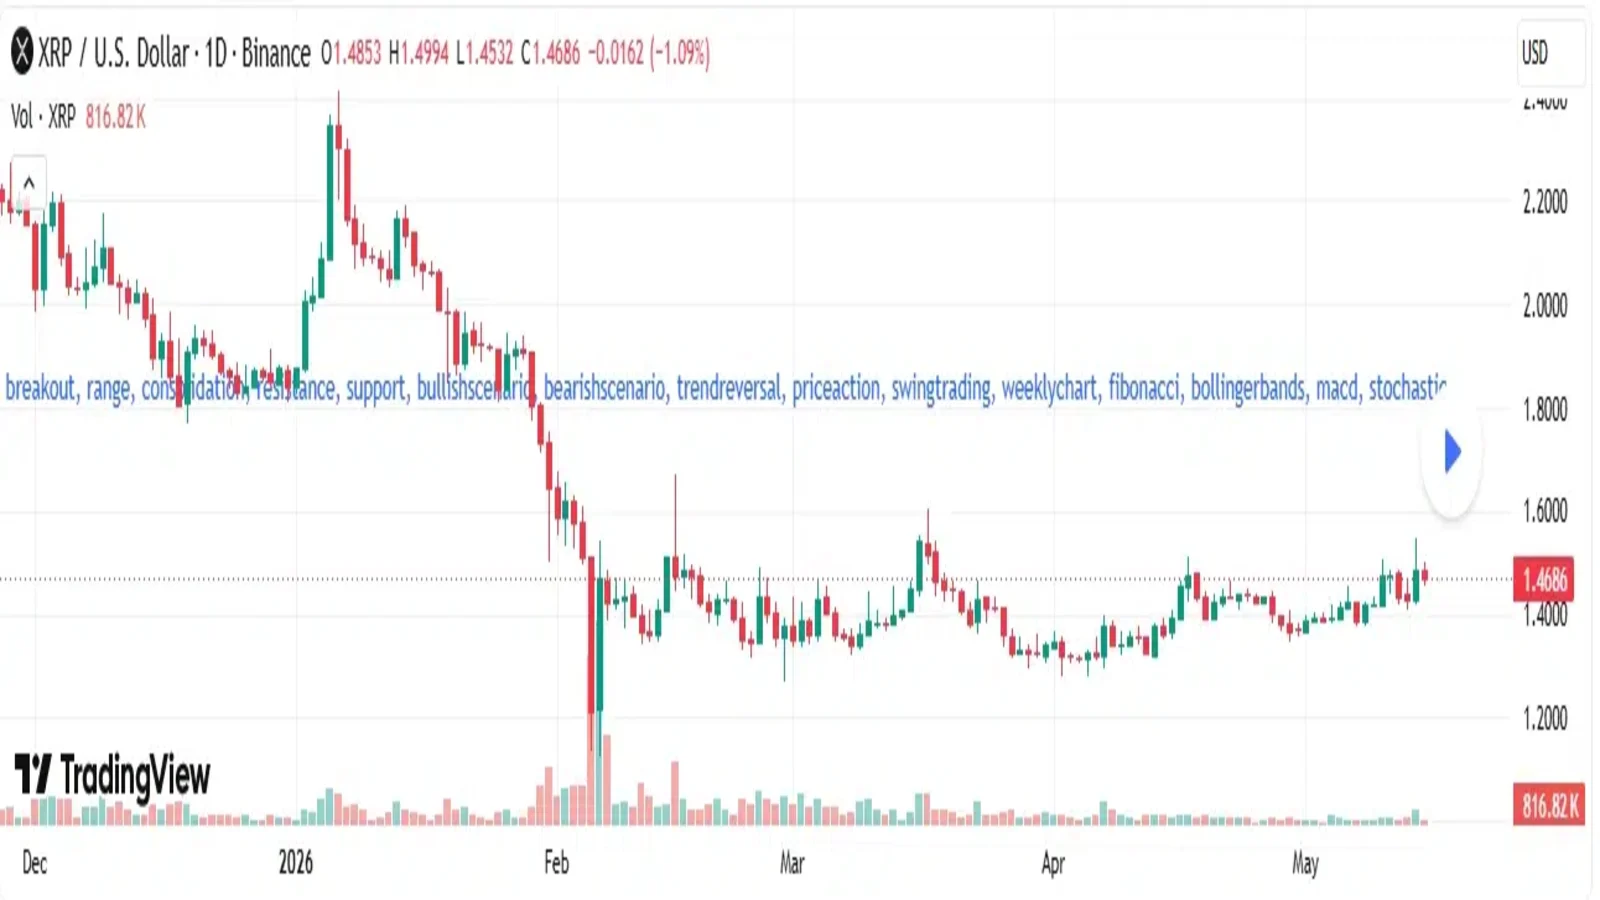
Momentum signals remain mixed. The MACD indicator is still slightly positive, showing some underlying strength, while the Stochastic indicator is starting to turn downward, hinting that upward pressure is slowing. This combination suggests the market is waiting for a clear breakout direction.

In case of an upside breakout above $1.5625, a bullish rally towards $1.9980 and $2.3519 is expected. On the contrary, if the XRP price breaks down below the $1.3671 mark, further downside targets of $1.2695, $1.1718, and $1.0742 are expected.

This article contains market analysis and price predictions. These are not guarantees. Crypto markets are volatile. Always DYOR. Not financial advice.

Also Read | Hyperliquid (HYPE) Price Eyes $100 Target Amid Strong Bullish Momentum

Filed Under: Cryptocurrency News, Ripple (XRP)

HBAR Price at Crossroads With $0.103 Resistance in Focus

By Bena Ilyas | Edited By Ammar Raza,May 16, 2026, 4:00 PM

Hedera Hashgraph (HBAR) price has entered a weak consolidation phase after facing selling pressure. Its price direction is highly unpredictable, with upward momentum failing to gather steam. The subsequent move will depend on whether the support level is breached or defended in the coming days.

At the time of writing, HBAR is trading at $0.09081. Over the last 24 hours, the HBAR price has dropped by 3.05%, while trading volume stands at $119.82 million and market capitalization is around $3.93 billion. The recent movement shows that the HBAR  is still struggling to build strong upward continuation after short rebounds.

HBAR price chart
Source: CoinMarketCap

Also Read | Cardano Price Holds $0.25 Support as Wealth Tech Forum Sparks Optimism

HBAR Price Remains in Correction

On May 16, 2026, crypto analyst More Crypto Online revealed that HBAR’s price is still undergoing a corrective recovery stage. Although there have been a couple of rebounds from the lows recorded during March and April, the rebound does not yet show any sign of becoming a trend.

According to the primary view, the price of HBAR might still move a little higher to reach a downtrend line marked in yellow, with resistance anticipated at $0.103. This situation remains relevant as long as the HBAR price maintains its support level of $0.078 – $0.088.

HBAR price chart
Source: More Crypto Online’s X Post

The risk setup regarding the HBAR is triggered when it drops beneath the recent swing low at $0.087. The violation of the mentioned support level will make the short-term outlook bearish and boost the likelihood that the previous bullish trend is over.

Support areas for the HBAR price stand at $0.088, $0.087, and $0.078, with resistance positioned around $0.103. In general, the HBAR price is still undergoing corrective recovery dynamics and does not demonstrate any clear bullish force.

HBAR Price Momentum Starts to Slow

In terms of technical analysis, the RSI of the HBAR stands at 47.36, with its moving average standing at 55.31. The fall below the neutral point of 50 indicates that the strength of the buying pressure is declining following the rally in May.

HBAR technical indicator chart
Source: TradingView

Moreover, the MACD remains slightly bullish. The MACD line stands at 0.00098, while the signal line stands at 0.00095, with the histogram being slightly positive, at 0.00003. This implies that buyers are still holding the upper hand, although the narrowing spread between the two lines means that the HBAR price may lose momentum soon.

This article contains market analysis and price predictions. These are not guarantees. Crypto markets are volatile. Always DYOR. Not financial advice.

Also Read | Dogecoin Price Could Rebound Toward $0.15 if Buyers Regain Momentum

Filed Under: Cryptocurrency News

DASH Price Could Surge Toward $143 if Bulls Maintain Key Support Level

By Sajjal Ali | Edited By Ammar Raza,May 16, 2026, 2:00 PM

DASH is attempting a recovery after defending key support following a falling wedge breakout. Technical indicators show weakening short-term momentum as the DASH price tests major EMAs. Meanwhile, declining open interest and trading volume reflect cautious sentiment and reduced trader participation in the derivatives market. According to CoinMarketCap, DASH is trading at $41.12 with a daily decline of 9.02%.

DASH current price

Source: CoinMarketCap

Open Interest and Volume Shows Decreasing Activity

According to Coinglass, the DASH open interest declined by 15.01%, falling to $56.03 million. This decrease indicates that traders are closing positions and reducing exposure in the market. Lower open interest often reflects weakening participation, declining speculative activity, or expectations of reduced volatility in the near term.

DASH open interest and volume

Source: Coinglass

Trading volume also dropped significantly by 26.89%, settling at $73.64 million. The decline suggests lower market activity and reduced engagement from investors. Such a decrease may point to cautious sentiment among traders and a temporary slowdown in overall market momentum.

Also Read: DASH Price Prediction: Breakout Setup Could Trigger Rally Toward $476

DASH Price Eyes $143 as Bulls Defend Key Support

Furthermore, the crypto analyst Jonathan Carter pointed out that Dash has started moving upwards as it managed to break out of a tested broken falling wedge formation. 

The move is expected to be continued due to the support from buyers who have managed to defend all key support levels, hence creating market confidence. The experts anticipate the next bull trend due to the retested confirmation.

DASH price prediction

Source: Jonathan Carter’s X Post

As the DASH price targets an extension of its recovery rally, market analysts have begun focusing on its recovery levels. 

These levels include $58 and $71, and with an increased bullish momentum, they can be driven to levels of $89 and $104. With more bullish momentum in the wider cryptocurrency sector, the DASH price may target levels up to $143.

Technical Indicators Point to Decreasing Strength

According to TradingView, the trend for DASH starts from a severe fall, followed by an initial attempt to recover. The DASH price hit its peak near $90.00 before falling with precision throughout March to reach $30.00. 

A strong positive breakout at the start of May saw the price of Dash surpass $58.00, only to undergo a significant retracement afterward.

DASH technical analysis

Source: TradingView

Currently, the DASH price hovers at roughly $41.018, below its 20-day exponential moving average (EMA). This is the point where the DASH price is testing support, as all three critical averages, i.e., the 50-, 100-, and 200-day EMAs, are at $40.00. 

With regards to the RSI, the indicator currently stands at 46.68, indicating bearish short-term pressure on the asset.

This article contains market analysis and price predictions. These are not guarantees. Crypto markets are volatile. Always DYOR. Not financial advice.

Also Read: DASH Price Prediction: Bulls Target $50 as Structure Turns Positive

Filed Under: Cryptocurrency News, Altcoin News

Ethereum Price Approaches Critical Support as Bulls Eye $2,280 and $2,390 Levels

By Bena Ilyas | Edited By Ammar Raza,May 16, 2026, 1:00 PM

Ethereum (ETH) price trend is bearish on May 16, 2026, as the overall cryptocurrency market continued to experience low trading volumes and lackluster performance. Although there have been some setbacks for the crypto market, market watchers expect the Ethereum price to test an essential support level that may spark a rally in the near future.

At the time of writing, ETH is trading at $2,175.5 with a 24-hour trading volume of $16.22 billion and a market capitalization of $263.96 billion. According to CoinMarketCap, the Ethereum price dropped 3.45% over the last 24 hours, reflecting continued selling pressure across the market.

ETH price chart
Source: CoinMarketCap

Also Read | Ethereum Price Weakens Short-Term but Long-Term Target Remains $5,000

Ethereum Price Approaches Lower Channel Support

On May 16, 2026, a renowned crypto analyst, Ali Martinez, released a report where he highlighted the fact that the price of Ethereum had dropped back to its bottom trading range. From his analysis, it can be inferred that this could be a good buying opportunity for investors.

ETH 4-hour price chart
Source: Ali Martinez’s X Post

Martinez says that should the buying push grow from the current levels, the price of Ethereum would rise toward the middle of the channel level at $2,280. With a stronger bounce, the price of Ethereum could rise to $2,390.

Ethereum derivatives show mixed signals

While the price movement is in progress, the derivatives market gave contradictory results. The open interest rose by 1.93% to reach $33.74 billion, demonstrating that there is still an interest among the market players to initiate positions under unstable circumstances. Nevertheless, the total trading volume dropped by 20.87% to be at $41.09 billion.

ETH open interest and volume chart
Source: Coinglass

Meanwhile, the OI-weighted funding rate remained positive at 0.0049%, indicating that many derivatives investors anticipate a quick rebound in the price of Ethereum soon. Despite the slowdown in trading, a positive funding rate indicates that there is a minor bullish bias towards buying Ethereum.

ETH OI Weighted chart
Source: Coinglass

This article contains market analysis and price predictions. These are not guarantees. Crypto markets are volatile. Always DYOR. Not financial advice.

Also Read | XRP Price Builds Long-Term Setup as Fibonacci Extensions Target $8

Filed Under: Cryptocurrency News, Ethereum (ETH)

Aptos (APT) Price Forecast: KRW1 Integration Boosts Bullish Case Toward $1.24

By Tina Fatima | Edited By Ammar Raza,May 16, 2026, 11:33 AM

Aptos (APT) price remains under pressure despite strengthening sentiment surrounding the KRW1 stablecoin integration backed by BDACS Korea. While the broader market structure still supports bullish continuation, RSI and MACD indicators show fading momentum and increasing short-term selling pressure across the market.

Aptos Price Holds Bullish Structure Despite Pullback

APT price remains inside a broader recovery structure after rebounding strongly from March lows near the major order block zone.

Price swept external liquidity several times before establishing higher lows and breaking above previous consolidation resistance. Recent rejection near the upper range signals temporary exhaustion and short-term selling pressure emerging.

The highlighted order block between the mid-$0.80 and low-$0.90 region continues acting as the chart’s strongest demand area.

APT price is now retracing toward this support after failing to maintain momentum above recent highs. The SSL region near $0.98 could provide temporary stabilization before another directional move develops.

APT Price Prediction chart
Source: @CryptoPatel

Overall market structure still favors bullish continuation because the APT price has shifted from forming lower lows toward establishing higher highs.

Previous breakout confirmation supports long-term upside potential if buyers defend the highlighted demand zone.

A strong rebound could drive the price toward external liquidity near the $1.24 resistance region, according to the crypto analyst Crypto Patel.

Also Read: Aptos Price Forecast: Could APT Surge to $1.14 in the Coming Sessions?

RSI and MACD Signal Growing Bearish Momentum

From an indicator perspective, the RSI (14) currently holds a value of 43.30 and is now below the yellow line of 58.68.

This is indicative of increasing bearish momentum that will move the price away from overbought territory, where it currently is in a neutral position, but fast approaching oversold territory.

APT tradingview chart
Source: TradingView

The MACD indicates that there is a bearish crossover happening as the MACD line turns blue below the signal line, which is orange at 0.03206.

Additionally, there has been a change in the color of the histogram to red at -0.01197, indicating an increase in short-term selling pressure.

KRW1 Stablecoin Boosts Aptos Commerce Expansion

Despite the price action, the introduction of the KRW1 stablecoin project is driving up the bull sentiment for Aptos as the platform continues its deeper integration in Asia’s digital payment landscape.

Backed by BDACS Korea, the KRW pegged stablecoin may help drive on-chain transactions, increase liquidity, and bring in institutions.

This event will reinforce Aptos’ position as the underlying structure of scalable finance applications and machine-enabled transactions.

Considering the growing interest among Koreans in regulated stablecoins, the project may demonstrate steady price growth in the coming years due to the continued development of commerce-related projects on top of the fast-growing blockchain platform.

This article contains market analysis and price predictions. These are not guarantees. Crypto markets are volatile. Always DYOR. Not financial advice.

Also Read: Aptos (APT) Price Prediction: Can $2 Flip Open Path to $18?

Filed Under: Altcoin News

Grayscale and VanEck Update BNB ETF Filings as SEC Review Intensifies

By Bena Ilyas | Edited By Ammar Raza,May 16, 2026, 10:25 AM

BNB ETF market is witnessing renewed momentum as major asset managers continue refining their filings under the ongoing U.S. Securities and Exchange Commission (SEC) review process. These amendments imply continued efforts toward launching spot BNB ETFs amid competition from rival crypto investments.

Bloomberg ETF analyst James Seyffart reported that Grayscale Investments has submitted a second amended S-1 filing for its proposed spot BNB ETF. The updated document indicates the firm may be incorporating feedback from the SEC as part of the ongoing review process for potential approval in the United States market.

Grayscale and VanEck BNB ETF
Source: James Seyffart’s X Post

VanEck filed its fifth amended prospectus for a BNB ETF on the same day, implying that issuers continue to engage regulators to ensure compliance with regulatory requirements in the US.

Also Read | Dogecoin Price Could Rebound Toward $0.15 if Buyers Regain Momentum

SEC Review Drives Continued ETF Filings Momentum

Canary Capital submitted its first amended filing for a Staked TRX ETF linked to the TRON ecosystem. The proposed structure combines exposure to TRX with staking yield features, reflecting expanding interest in hybrid crypto exchange-traded products within regulated frameworks being evaluated by U.S. financial authorities during the ongoing review cycle process.

On the other hand, T. Rowe Price filed the fourth amendment on its crypto ETF proposal, which reflects the growing number of amendments from issuers who are trying to meet the SEC’s demands for regulatory compliance. Multiple amendments from different issuers reflect continued discussions between issuers and the SEC as they evaluate various crypto investment applications.

Growing Institutional Focus on BNB ETF and Altcoin Exposure

Recent filings demonstrate increasing competition among asset managers seeking exposure to alternative digital assets beyond Bitcoin and Ethereum. BNB-focused ETF proposals and staking-based products tied to TRX reflect broader efforts to expand institutional access through regulated investment vehicles in the evolving cryptocurrency market landscape under the SEC oversight framework and regulatory.

BNB is currently trading at $661.06, with a 24-hour trading volume of $1.66 billion, and a market cap of $88.92 billion, making up 3.40% of the crypto market. At the time of writing, BNB had fallen by 3.20% over the past 24 hours.

BNB price chart
Source: CryptoMarketCap

This article contains market analysis and price predictions. These are not guarantees. Crypto markets are volatile. Always DYOR. Not financial advice.

Also Read | Cardano Price Holds $0.25 Support as Wealth Tech Forum Sparks Optimism

Filed Under: Cryptocurrency News, Binance Coin (BNB)

XRP Price Builds Long-Term Setup as Fibonacci Extensions Target $8

By Zagham Abbas | Edited By Messam Raza,May 16, 2026, 8:00 AM

XRP price action continues to struggle because of its movement inside a tight consolidation formation. This is being closely observed by investors who want to know if the price of XRP will break out or break down from its current position.

At press time, the XRP is trading at $1.43 with a 5.09% decline over the last 24 hours. Despite the drop, trading activity remains strong with $5.06 billion in 24-hour volume and a $89.01 billion market capitalization, according to CoinMarketCap.

XRP price chart

Source: CoinMarketCap

Also Read | TAO Price Rebounds From Accumulation Zone: Is a Rally to $3,000 Imminent?

XRP Price Consolidation Signals Breakout Setup

On May 15,  2026, a popular crypto analyst, Xaif Crypto, noted that the price of XRP has continued to move sideways within a narrow range amid low but growing volumes. This type of behavior usually occurs ahead of a bigger move in the XRP price when it is “cooling down.”

XRP price chart

Source: Xaif Crypto’s X Post

According to the Xaif Crypto, the recent action of the XRP indicates that there is some stability in the price following the selling trend; therefore, there may be a formation of a temporary base within the market. This might lead the XRP to move from consolidation to expansion mode.

XRP Builds Cup Handle

Furthermore, another well-known analyst, ChartNerd, presented a longer-term analysis that showed how the cryptocurrency might be building a cup and handle formation for several years into the future. According to CharNerd, the larger trend is based on cyclical patterns of accumulation and distribution of the XRP price.

 XRP price chart

Source: ChartNerd’s X Post

In this case, the structure of the cup could have been formed already, whereas the handle formation might still be forming following the high reached by XRP in its preceding cycle. In this phase, XRP price may visit lower support levels, focusing on the $0.89 level, which corresponds to the 0.5 Fibonacci retracement zone.

The price action in history also reveals frequent retracements to similar levels in several cycles, suggesting that the XRP price tends to follow organized movements over extended periods, as opposed to random fluctuations. This trend has made some experts emphasize macrostructure over volatility.

In case the bullish continuation path holds, the Fibonacci extension charts reveal a possible long-term target above the present price, with calculations stretching up to $8 and more. Yet, it should be noted that such developments will depend entirely upon the maintenance of the structural strength of the XRP price.

Overall, at the moment, XRP is sitting at an important technical crossroads between short-term compression and long-term structural uncertainty, which means that the next important action will determine the path of the XRP price for the weeks and months ahead.

This article contains market analysis and price predictions. These are not guarantees. Crypto markets are volatile. Always DYOR. Not financial advice.

Also Read | SEI Price Analysis: Can Bulls Reclaim $0.10 After Long-Term Bearish Breakdown?

Filed Under: Cryptocurrency News

Dogecoin Price Could Rebound Toward $0.15 if Buyers Regain Momentum

By Zagham Abbas | Edited By Ammar Raza,May 16, 2026, 7:00 AM

Dogecoin price continued to be under selling pressure as the meme currency experienced a retracement after a bullish trend. Even though the DOGE faces some downward pressure, Dogecoin’s price is above an important support zone, implying that bulls are fighting for market dominance.

At the time of writing, DOGE is trading at $0.1117 with a 24-hour trading volume of $3.91 billion and a market capitalization of $17.26 billion. The DOGE posted a 1.46% down over the last 24 hours, reflecting reduced buying momentum after the recent rally.

DOGE price chart

Source: CoinMarketCap

Also Read | Ethereum Price Holds Above $2,300 as Institutional Demand Grows

Dogecoin Price Signals Bullish Breakout

As reported by a crypto analyst, BitGuru, DOGE appears to be ready for a bullish trend as it has spent many months consolidating within a tight price range. As per the analysis of the crypto expert, market sentiment is slowly coming back, which might help the coin reach $0.13 to $0.15 in the short term.

DOGE price chart

Source: BitGuru’s X Post

BitGuru also pointed out that the Dogecoin price is also beginning to generate higher support levels, which is typically associated with building confidence following a lengthy consolidation phase. While it appears that the bounce-back is slow, sustaining a price above the support region can help the bulls build more traction.

Dogecoin Price Signals Momentum Cooling

From an indicator point of view, it appears that the current price surge in the cryptocurrency Dogecoin will cool off shortly. This is seen through the RSI 14, which is currently trading at a value of 59.66, having earlier hit values close to 67, which indicated higher momentum in buying. Even though the value has dropped, it is still above the 50 value mark.

DOGE also remains above its 20-day moving average of $0.10853, maintaining a slight uptrend in the short term. Nonetheless, the price behavior shows that buying momentum is waning as investors are getting cautious about the present price.

DOGE technical indicator chart

Source: TradingView

Conversely, the MACD technical indicator continues trading at positive levels. At the moment, the MACD line is at 0.00385, with the signal line at 0.00388. Nonetheless, the histogram is now negative at -0.00003, signifying that the upward momentum may be fading following the latest rally.

In case of renewed demand, Dogecoin price might make a further push towards the critical $0.13 level. Conversely, any inability of the current level to hold might force the currency to consolidate around its levels or even move downward towards the $0.108 mark.

This article contains market analysis and price predictions. These are not guarantees. Crypto markets are volatile. Always DYOR. Not financial advice.

Also Read | Avalanche Price at $10.12 Surges Amid Avalanche Ecosystem Boom

Filed Under: Cryptocurrency News

Ethereum Price Weakens Short-Term but Long-Term Target Remains $5,000

By Zagham Abbas | Edited By Messam Raza,May 16, 2026, 6:00 AM

Ethereum price is under pressure in the short run due to increased selling and reduced momentum. Buying strength continues to fade even as some long-term perspectives see this area as a possible area for accumulation. It is time to keep an eye on critical support areas.

At the time of writing, Ethereum is trading at $2,226.86, with a 24-hour trading volume of $33.17 billion and a market capitalization of $268.45 billion. Over the last 24 hours, the Ethereum price has dropped by 3.74%, reflecting growing weakness in near-term buying strength across the market.

Source: CoinMarketCap

Also Read | Ethereum Price Holds Above $2,300 as Institutional Demand Grows

Ethereum Price Signals Weak Short-Term Control

On May 15, 2026, a crypto analyst, Crypto Patel, referred to the Ethereum rainbow chart, stating that the Ethereum price currently resides in what he terms as “a cheap zone.” The analyst explained that this is usually the position that is associated with fear on the part of many investors.

LOOK AT THE #ETHEREUM RAINBOW CHART RIGHT NOW

It's sitting in the "Cheap" zone.

I've been in this market long enough to know, this is the zone where most people are scared to buy, and that's exactly why it works.$ETH has only been here twice before. Both times, within 18… pic.twitter.com/HwCmJdalq3

— Crypto Patel (@CryptoPatel) May 15, 2026

And according to Patel, the Ethereum price was in this range only a couple of times previously. In both instances, the price action of ETH shifted towards the “take profit” range, which takes place roughly 18 months after an upward cycle starts.

His approach is to continue his accumulation process as long as the $2,000–$1,500 band remains intact. In case the price of Ethereum falls below this level, his choice will be slow accumulation rather than an emotional response. The future targets for the Ethereum price are set at $5,000, $10,000, and $15,000.

Momentum Indicators Show Cooling Ethereum Price Strength

Despite the long-term perspective, the short-term indications show that the ETH price is weakening. The Relative Strength Index indicator fell to 43.22, breaking through the crucial resistance at the 50 mark, indicating the decreasing buying interest while sellers have started becoming dominant.

Source: TradingView

MACD technical analysis is further confirmation of weak momentum. The MACD line is currently at -13.71, trading below the signal line of 0.52, and the histogram has now turned red. The change indicates weakening upside momentum for the Ethereum price and increased risks of declines ahead.

In case the trend persists, price action on Ethereum is likely to approach the 100-day MA near $2,145 as an important level for bulls to defend their position.

This article contains market analysis and price predictions. These are not guarantees. Crypto markets are volatile. Always DYOR. Not financial advice.

Also Read | SHIB Price Analysis: Falling Wedge Breakout Hints at 6x Move to $0.000030

Filed Under: Cryptocurrency News, Altcoin News

Cardano Price Holds $0.25 Support as Wealth Tech Forum Sparks Optimism

By Athulyamol VS | Edited By Messam Raza,May 16, 2026, 5:00 AM

Cardano is a blockchain platform using a research-based approach for the development of its smart contract ecosystem while focusing on scalability and governance, supporting the long-term Cardano price narrative. At press time, ADA was trading at around $0.26 with a slight increase over the past 24 hours.

Cardano Price Holds Above $0.25

The TradingView charts for the ADA token show the token maintaining its price within a narrow band while experiencing minor consolidation at the time, although price levels suggest buyers appear willing to defend the support at the recent low of $0.25 for the Cardano price.

From a technical indicator standpoint, the RSI remains neutral, indicating there is currently no overbought or oversold bias on ADA.

The moving averages have formed into a primarily flat configuration, indicating some degree of consolidation has occurred rather than producing any significant breakout trend. Trading volume is at moderate levels, indicating cautious participation in this market rather than aggressive buying of ADA.

Though there isn’t currently a significant breakout in terms of price levels, this provides short-term potential for further increases in the price of ADA based on the current trend line.

Cardano Price Holds Above $0.25
Source: TradingView

Also Read: ADA Price Analysis: Cardano Eyes $0.33 as $0.25 Support Holds

ADA Gains Visibility Following Wealth Tech Forum Mention

Attention was drawn to developments at the Wealth Tech Forum in the context of Cardano’s future wealth technology discussions and other developments.

Cardano Foundation shared a post that pointed out the addition of “Wealth Tech Forum” as an extension of the work Cardano has been doing to connect blockchain technology with financial technologies.

While the Wealth Tech Forum update did not appear to have a near-term price impact on ADA, the update may improve investor sentiment by drawing additional interest from institutional investors to the Cardano ecosystem.

The increased visibility created by institutional conversations with respect to the Cardano Ecosystem may promote a more stable environment for traders during periods of consolidation and may support the Cardano price outlook.

We are proud to sponsor the Wealth Tech Executive Forum hosted by @CV_Labs on 26 May in Zürich.

Sandro Knöpfel will give a keynote on how financial infrastructure is being rebuilt, and the role Cardano plays in that shift. pic.twitter.com/fU0wfEzEHy

— Cardano Foundation (@Cardano_CF) May 15, 2026

ADA’s price remains stable in the short term and is still holding just above major support levels despite ongoing uncertainty in the overall crypto market.

The additional interest generated by the Wealth Tech Forum on the overall progress of the Cardano Ecosystem and its future place in relation to the blockchain industry continues to provide support for its ecosystem growth and the development of investment opportunities within the Cardano Network.

However, the overall cryptocurrency market continues to be very volatile; therefore, ADA’s short-term pricing may be influenced by sentiment related to the larger cryptocurrency market.

This article contains market analysis and price predictions. These are not guarantees. Crypto markets are volatile. Always DYOR. Not financial advice.

Also Read: Cardano Price Faces Downside Risk Toward $0.145 Support Zone

Filed Under: Cryptocurrency News, Altcoin News

  • « Go to Previous Page
  • Page 1
  • Interim pages omitted …
  • Page 15
  • Page 16
  • Page 17
  • Page 18
  • Page 19
  • Interim pages omitted …
  • Page 3615
  • Go to Next Page »

Primary Sidebar

Recent Posts

  • Boerse Stuttgart, Societe Generale & flatexDEGIRO Partner for Tokenized Securities Platform May 22, 2026
  • JASMY Price Breakout Above Weekly High Could Trigger Strong Rally to $0.27 May 22, 2026
  • Why RLUSD Stablecoin Cannot Replace XRP in Digital Asset Routing Explained May 21, 2026
  • Circle-Backed QCAD StableFX Enables Real-Time Institutional FX Settlement May 21, 2026
  • Avalanche Stablecoin Partnerships Fuel Growth as AVAX Eyes $13.52 Level May 21, 2026

Footer

News

  • Latest News
  • Altcoin News
  • Bitcoin (BTC)
  • Blockchain
  • Tron (TRX)
  • World

Digest

  • Meet the Founder
  • Price Winning Article
  • DeFi
  • Cyber Security
  • Crypto Scam

Industry

  • Project Review
  • Technology
  • Fintech
  • Tron Exchange
  • New in Town

Tron Universe

  • Event and Tron Parties
  • New in Town
  • Tron Tokens

FOLLOW US

  • Facebook
  • Telegram
  • Twitter
  • Linkedin

Editorial Policy | Privacy Policy | Disclaimer | Terms and Conditions | Masthead

Copyright © 2026 · Tron Weekly. All Rights Reserved. NOTE: Tron Weekly is an independent crypto news site that adheres to the strict journalism policy anchored on transparency, trust, and objectivity, we have no affiliation with the TRON Foundation, its founder Justin Sun or any other cryptocurrency firm.