• Skip to primary navigation
  • Skip to main content
  • Skip to primary sidebar
  • Skip to footer
  • About TronWeekly
  • Write for us
  • Terms and Conditions
  • Privacy Policy
  • Disclaimer
  • Contact
  • All Posts
  • Advertise

TronWeekly

Crypto World News

  • Home
  • Latest News
  • Opinion
    • Education
    • Best TRON Wallets
    • Beginner’s guide to TRON
    • Tron Tokens
    • Market Analysis
  • Industry
    • Tron Exchange
    • Project Review
  • Press Release
  • Bitcoin (BTC)
  • Ripple (XRP)
  • Advertise
  • About TronWeekly
    • The Team
    • Editorial Policy
    • Write for us
    • Privacy Policy
    • Disclaimer
    • Terms and Conditions
    • Contact
You are here: Home / All Posts

All Posts

SUI Price Surges 75%: Is a Massive Bull Run Toward $20 Just Beginning?

By Mishal Ali | Edited By Messam Raza,May 12, 2026, 4:00 AM

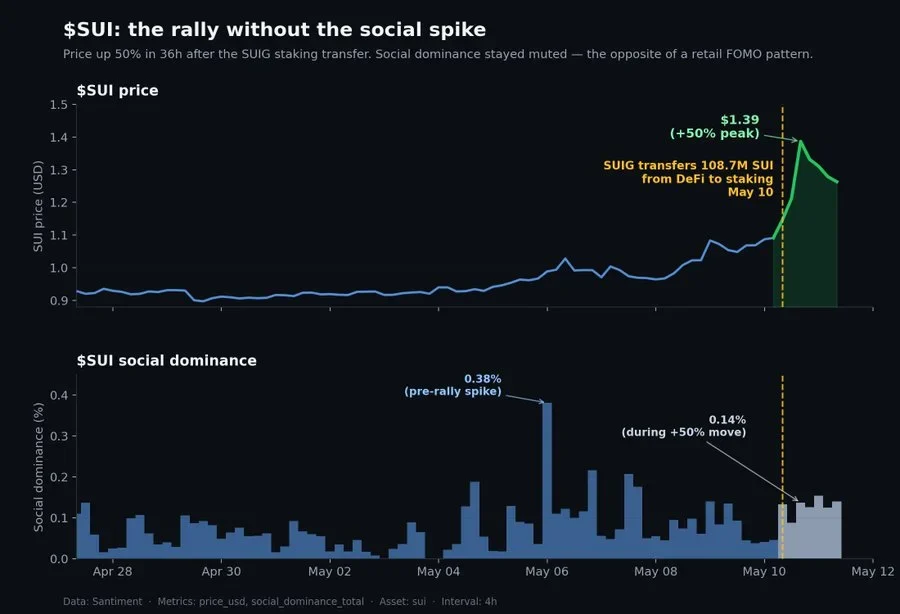
Sui (SUI) price action shows a strong upward move of around 75%, indicating sustained bullish momentum, but the SUI price still remains in the accumulation zone in the long term. However, derivative data point to a mixed outlook with decreasing open interest despite the rising volume. According to CoinMarketCap, SUI is trading at $1.31 with a weekly gain of 40.74%.

SUI current price

Source: CoinMarketCap

SUI Derivative Data Point to Mixed Outlook

According to Coinglass, the SUI open interest declined by 3.37%, totaling $937.92 million, suggesting reduced outstanding derivative positions, potentially reflecting position closures, lower speculative engagement, and shifting trader sentiment within the market and indicating decreased leverage exposure among participants.

SUI open interest and volume

Source: Coinglass

However, trading volume increased by 21.50%, reaching a total of $4.42 billion, indicating stronger market activity and participation, with heightened transaction flow and improved liquidity across the asset compared to previous measurements and earlier trading sessions.

Also Read: SUI Price Analysis: Bulls Target $1.30 as Rally Gains Momentum

SUI Price Breakout Points to Expansion Toward $20

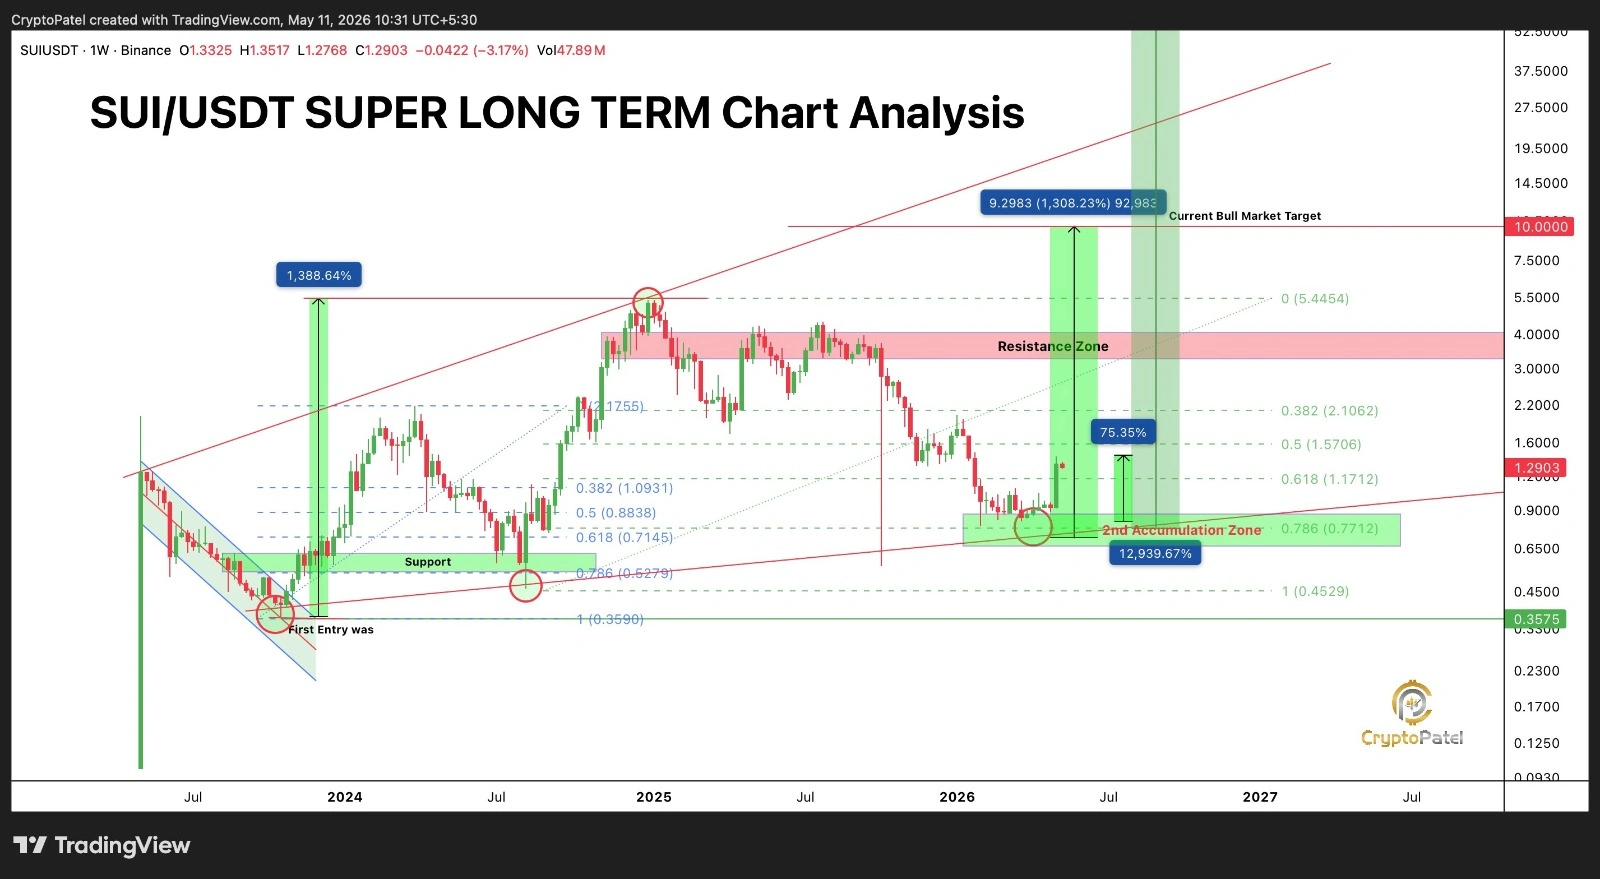
Furthermore, the crypto analyst Crypto Patel highlighted that the SUI price has made gains of nearly 75%, emerging out of its prior accumulation zones and gaining back some attention from traders. 

With gains like this in talks, technical indications suggest that the trend remains in its early stages, with prices continuing to build momentum without the exuberance usually associated with cycle tops.

Crypto Patel states that the most recent consolidation witnessed by the SUI price represents a continuation of accumulation, with increased volatility and slow liquidity building. 

These periods of inaction often precede stronger directional moves within cryptocurrency cycles; however, the future remains to be seen. This current situation has been under observation to see if the SUI price action will be able to break out or be range bound.

SUI price prediction

Source: Crypto Patel’s X Post

The projections for the SUI price that are floating around in the trading circles are based on expectations of speculative levels at $5, $10, and possibly $20 in case there is more favorable weather ahead. 

The SUI price targets might not be certain, but they reflect the sentiment in a market that is optimistic by confidence and positivity. As usual, the performance of SUI would depend on factors like liquidity and sentiment.

This article contains market analysis and price predictions. These are not guarantees. Crypto markets are volatile. Always DYOR. Not financial advice.

Also Read: Will SUI’s Default Privacy Model Strengthen Web3 Payments in 2026?

Filed Under: Cryptocurrency News, Altcoin News

Can XRP Price Reach $1.63 by May 31 as Momentum Grows?

By Athulyamol VS | Edited By Athulyamol VS,May 12, 2026, 3:30 AM

XRP price could move towards $1.63 from now until the end of May, as technical analysis and market expectations continue aligning with stable momentum and improving market structure for the XRP Ledger’s native cryptocurrency. At press time, the coin is trading at approximately $1.47 with an increase of around 2.8% over the past 24 hours.

XRP Price Builds Momentum Toward $1.63

The TradingView chart shows a gradual series of upward movements since XRP began bouncing off previous support zones. Price is currently making higher lows, indicating there is still buyer interest at key levels despite increased short-term volatility.

Although the Relative Strength Index (RSI) is still on the bullish side, it has yet to reach an “overbought” level, which may indicate continued bullish momentum.

The Bollinger Bands show XRP trading in the upper half of the bands, suggesting stable price strength while volatility remains relatively controlled. At the same time, the bands are not widening aggressively, indicating that price action continues moving within a stable structure.

XRP price analysis
Source: TradingView

Also Read: XRP Price Analysis: Break Above Resistance Opens $1.4700 Upside Target

XRP Price Signals Strength From Ali Charts Analysis

According to a recent post on the X account “Ali Charts,” XRP is approaching a critical resistance zone while continuing to trade within a bullish ascending channel on the 4-hour chart.

The chart indicates XRP remains in a higher low structure, suggesting buying activity is still present as the price attempts to hold above nearby support levels. The post also noted that XRP must close above the top of the channel at $1.49 to trigger a breakout toward $1.80.

$XRP must close above the top of the channel at $1.49 to trigger a breakout toward $1.80. pic.twitter.com/QrAbz4IIbI

— Ali Charts (@alicharts) May 11, 2026

XRP Price Could Rise to $1.63 According to CoinCodex

XRP is forecasted by CoinCodex to increase to $1.63 by May 31, representing an estimated 10.84% increase. The XRP price forecast also reflects a bullish technical structure since the asset has remained above key support zones with positive momentum indicators.

Source: Coincodex

XRP’s current technical pattern, increasing momentum indicators, and bullish market assumptions all support potential upside as we near the end of May. Maintaining price action above key support levels is very important in order for XRP to continue its upward movement.

Additionally, several resistance levels are still limiting short-term price action since the entire cryptocurrency market continues to experience significant volatility.

This article contains market analysis and price predictions. These are not guarantees. Crypto markets are volatile. Always DYOR. Not financial advice.

Also Read: XRP Price Analysis: Is a Macro Bottom Forming Near $0.93?

Filed Under: Cryptocurrency News

NEAR Price Breakout Above $1.41 Sparks Hope For a Rally Toward $2 Target

By Mishal Ali | Edited By Messam Raza,May 12, 2026, 3:00 AM

NEAR Protocol (NEAR) has broken above key resistance, turning it into support with bullish momentum toward higher levels; technical indicators confirm a strengthening of the NEAR price trend despite volatility.

While derivatives data shows rising trading activity but declining open interest, it indicates mixed trader commitment and cautious sentiment. According to CoinMarketCap, NEAR is trading at $1.54 with a weekly gain of 20.95%.

NEAR current price

Source: CoinMarketCap

NEAR Rising Volume Point to Improving Outlook

According to Coinglass, the NEAR trading volume rose significantly by 84.82%, reaching a total of $409.97 million, indicating strong market activity and increased participation from traders, reflecting heightened interest, liquidity, and momentum in the asset.

NEAR open interest and volume

Source: Coinglass

However, the open interest declined by 3.81%, falling to $299.26 million, suggesting a reduction in active positions held by traders and reflecting weaker market commitment alongside shifting sentiment and lower speculative engagement.

Also Read: NEAR Protocol Price Could Explode Toward $4 After Major Recovery Signal

NEAR Price Breakout Sets Stage for a Run to $2

Furthermore, the crypto analyst Michaël van de Poppe highlighted that the NEAR price has broken decisively above the key $1.41 level, a zone that previously acted as strong resistance. 

This move signals a shift in market structure, turning $1.41 into potential new support. The breakout suggests improving bullish momentum as traders reassess the asset’s trend and positioning within a newly formed trading range.

NEAR price prediction

Source: Michaël van de Poppe’s X Post

If the NEAR price holds above the $1.41 area, the sentiment remains constructive, as buyers remain in control within the fresh consolidation range. 

The next important resistance for the NEAR price lies near the $2.00 area, where more sellers may join the scene. Any continuation towards this level will highlight a bullish pattern and may initiate a recovery stage for the market.

Technical Indicators Support bullish Momentum

According to TradingView, NEAR is moving within an uptrend, breaking out of its consolidation phase and moving up to touch its upper Bollinger band level. 

The NEAR price reached its highest point of $1.60 before pulling back to the $1.54 region. This NEAR price is trading above its 20-day SMA of $1.40, reflecting that buyers dominate the market trend.

NEAR technical analysis

Source: TradingView

The MACD shows the start of the rally by displaying a clear bullish crossover. The blue line moves sharply above the signal line while the green bars widen. 

Although this rally is strong, its rapid move signals increased volatility given that the market is trying to keep these gains above the breakout level in May.

This article contains market analysis and price predictions. These are not guarantees. Crypto markets are volatile. Always DYOR. Not financial advice.

Also Read: NEAR price Analysis: Strong Break Above $1.50 Signals Potential Surge to $3

Filed Under: Cryptocurrency News, Altcoin News

Dormant Bitcoin Whale Moves Shocking $40 Billion

By Aishwarya shashikumar | Edited By Ammar Raza,May 12, 2026, 2:56 AM

A massive dormant Bitcoin whale, which had been inactive for four years, executed its first movement on Sunday. The whale moved coins worth nearly $40 billion to a new address after more than a decade of inactivity. The transfer received detection through Blockchain tracking service Whale Alert, which reported the event at approximately 19:16 UTC.

The coins moved from the address “1KAA8GGhVjjUjVTz1HKAjCyGNzAKQd882j” to “bc1qm6m6d33d02edr0k8yj9jgt027zl6dvx6thjrxy.” The wallet had stayed untouched since November 2013. Back then, Bitcoin (BTC) traded at a fraction of today’s price. No one knows who owns the wallet. No one knows why the transfer happened either.

💤 💤 💤 💤 💤 A dormant address containing 500 $BTC (40,717,094 USD) has just been activated after 12.5 years (worth 482,898 USD in 2013)!https://t.co/OBUcZ1rXQg

— Whale Alert (@whale_alert) May 10, 2026

Also Read: Trump Media Reports $405.9 Million Q1 Loss as Bitcoin Holdings Decline

Dormant Bitcoin Whale Sparks Fresh Market Speculation

Large Bitcoin holders, for their basic needs, move their funds from one location to another. Some users switch their wallets to achieve better protection of their assets. Some users distribute their assets between different wallet addresses. Traders maintain constant observation of these transactions because they provide information about upcoming market selling activities.

The destination wallet in this case shows no connection to any recognized crypto exchange. The detected wallet address does not match any existing records of known cryptocurrency exchanges. The transfer amount, which exceeded expectations, created unexpected effects on the market.

A Dormant Bitcoin Whale moving billions of dollars in BTC is never a minor event. These old wallets carry historical value because they contain digital currency from ancient times. Many of these wallets originate from the initial period of Bitcoin, when miners received high rewards but faced minimal competition.

Source: Whale Alert

Bitcoin crossed the $100,000 mark in late 2024 and has stayed near historic highs since then. The price increase made it possible for many starting investors to check their old digital wallets, which they had stopped using.

Dormant Bitcoin Whale Trend Continues Across Crypto Market

The recent transfer operation serves as evidence for an ongoing transfer trend that has been observed in the past. The number of dormant Bitcoin wallets that have become active again has increased over the last year. Whales who held their assets for over ten years have started to sell their holdings.

The biggest wave came in July last year. Blockchain analytics firms detected eight Satoshi-era wallets moving 10,000 BTC each for the first time in 14 years. Those transfers happened while Bitcoin traded above $100,000.

For now, the market remains calm. But traders will continue watching the newly activated wallet closely. In crypto, old coins rarely move without attracting attention.

Also Read: Strategy Bitcoin Sales May Occur Under Financial Conditions: CEO Explains

Filed Under: Cryptocurrency News, Bitcoin (BTC), World

Circle Secures $222 Million in ARC Token Private Sale Alongside Rising USDC Adoption

By Zagham Abbas | Edited By Ammar Raza,May 12, 2026, 2:29 AM

Circle Internet Group plans to issue 740 million ARC tokens worth $222 million through a private investment round led by a16z Crypto, with Arc’s valuation estimated at around $3 billion on a fully diluted basis.

The update was made along with the first-quarter earnings report for 2026. There has been an increase in the company’s revenues and reserves, although net income has fallen due to higher expenses.

circle key financial results

Source: circle.com

The private investment has seen significant support from several large financial institutions and venture capital firms. Among others, in addition to a16z Crypto, there are BlackRock, Apollo Funds, ARK Invest, Bullish, General Catalyst, Haun Ventures, Intercontinental Exchange, IDG Capital, Janus Henderson Investors, Marshall Wace, SBI Group, and Standard Chartered Ventures.

Circle completed the arrangements for the sale of the tokens on Friday, when it was agreed to sell ARC tokens at a price of $0.30 each. The issuance was done through a private placement exemption.

Also Read | Capital B Raises $17.8 Million to Expand Bitcoin Holdings

Circle Blockchain Token Strategy Overview

Arc was first launched by Circle in August 2025 as a layer-1 blockchain designed to facilitate payments using stablecoins. Later on, a whitepaper detailing ARC, a coordination token utilized for network coordination and management purposes, was published.

The Arc framework was built for stablecoin finance, tokenization of real-world assets, and programmable financial instruments, thus making it an essential component of Circle’s strategic roadmap.

As per the whitepaper, the native coin of Circle’s “Economic OS” platform is the ARCCoin. The current model involves a combination of permissioned validators, whereas the future plans include migration from Proof-of-Authority (PoA) to Proof-of-Stake (PoS).

The total starting supply will be set at 10 billion tokens. Approximately 60% of the total supply will be used in the ecosystem development process and will be used for grants and for developers. Circle will hold 25% of the tokens for its own use, while another 15% will be kept for future purposes.

Circle Reports Strong USDC Growth

The financial report from Circle showed strong growth in the company’s core stablecoin business. The circulation of USDC was up by 28% year over year at $77 billion.

On-chain transactions also witnessed an increase, with the value of transactions increasing by 263% to $21.5 trillion. Total revenue and reserves income increased by 20% to $694 million, driven by increased interest income generated from USDC reserves.

Circle q1 2026 highlights

Source: circle’s X Post

Despite that, net income fell by 15% to $55 million because of higher costs. The operating expense was up 76% at $242 million because of expenses like post-IPO stock compensation, salaries, tax, and investment in infrastructure and product development.

Despite increased expenses, the performance of Circle has also shown improvement, and adjusted EBITDA grew by 24% to $151 million.

As a result of the release, the stock price of Circle increased by 3% before the market opened and was trading at $116.7. In the last month, the company’s stock increased by 12%, while the increase in stock price during this year already exceeds 40%.

Also Read | Crypto.com Becomes UAE’s First Fully Licensed Crypto Payments Provider

Filed Under: Cryptocurrency News

Ondo Finance Integrates Tokenized Stocks into Hyperliquid DeFi

By Arslan Tabish | Edited By Ammar Raza,May 12, 2026, 2:00 AM

Ondo Finance has expanded its tokenized stocks and ETFs to Hyperliquid’s HyperEVM through LayerZero. The integration lets users bridge tokenized U.S. equities from Ethereum and BNB Chain into HyperEVM, adding new real-world asset access for decentralized traders and hedging strategies.

According to the announcement, users can move Ondo’s tokenized U.S. equities into HyperEVM and use them with supported perpetual futures markets. The setup brings spot equity exposure closer to derivatives trading inside one of the largest decentralized perpetuals ecosystems.

Also Read: Canton Network Developer Digital Asset Seeks $300 Million Funding at $2B Valuation

Ondo Adds Tokenized Assets to HyperEVM

Ondo Finance said around 35 tokenized assets are currently bridgeable to HyperEVM. The supported products include SPYon, QQQon, TSLAon, GOOGLon, and other tokenized stock and ETF products linked to traditional market exposure.

Traders are empowered to use the integration as a deeper tool for strategy in the market. Which encompass basis trades, funding rate arbitrage, delta-neutral hedging, and portfolio risk management in tokenized equities or perpetual futures contracts.

According to Ondo Finance, the goal is not to build fragmented on-chain liquidity. Instead, its tokenized stocks and ETFs are backed by liquidity from traditional equity markets while the products continue to function in DeFi.

Source: Ondo

This also broadens the scope of HyperEVM where it can be traded as a real-world asset. The integration opens up a way for Hyperliquid users to use tokenized equity positions and merge them with derivatives strategies that were difficult to run in their entirety on-chain pre-integration.

Melt Finance and Felix Protocol are the pioneers utilizing HyperEVM technology. Both protocols now offer Ondo tokenized stocks and ETFs on their platforms, bringing direct access to spot equity in the Hyperliquid environment.

Ondo Products Expand Through Felix Integration

Felix has integrated a wide range of Ondo products already. According to the announcement, this includes hundreds of U.S. equities and ETFs. Bridge from source chains to HyperEVM via LayerZero.

Ondo’s equity tokens offer real-world access to real securities. The products also encompass dividend after-tax payouts. The basic assets are supported by real-world tokens and kept off-chain via Ondo Global Markets.

Ondo Finance recently announced the completion of what it claims is the first near-real-time tokenized U.S. Treasuries cross-border redemption in the world. The pilot included J.P. Morgan’s Kinexys, Mastercard, Ripple, and Ondo’s OUSG product on XRPL.

Ripple carried out a partial redemption of its OUSG holdings. This in turn initiated a fiat payment to Kinexys via MasterCard’s MTN. It then sent a U.S. dollar payment to Ripple’s Singapore bank account in less than one minute.

According to Ondo Finance, it will allow for increased liquidity and functionality of tokenized stocks via the HyperEVM integration. This edition demonstrates further progress in tokenized Wall Street assets moving into blockchain markets on cross-chain infrastructure and institutional settlement experiments.

Also Read: Capital B Raises $17.8 Million to Expand Bitcoin Holdings

Filed Under: Cryptocurrency News

Aptos (APT) Price Prediction: Can $2 Flip Open Path to $18?

By Arslan Tabish | Edited By Ammar Raza,May 12, 2026, 1:30 AM

APT price prediction remained in focus, as traders watched whether Aptos could confirm a stronger recovery from its accumulation range. Analysts pointed to key breakout and support levels, while momentum indicators showed buyers building control.

As of press times, the Aptos trades near $1.13 after a 2.24% daily drop, while trading volume rose 160.93% to $216.63 million. According to CoinMarketCap data, the token gained 15.87% over the past seven days.

Source: CoinMarketCap

Also Read: Ethereum Price Analysis Shows ETH Testing $2,450 Breakout Zone

APT Price Prediction Shows Accumulation Setup

According to analyst Crypto Patel, APT could be in a generational accumulation zone. His high-timeframe view placed the token near $1.10 after an estimated 81% correction from its all-time high.

Patel set the high-risk range for the accumulation between $0.70 and $0.85. He said the next major target is $18, and it remains alive as long as the price keeps above $0.70.

The analyst also highlighted the 2025 capitulation followed by the formation of a descending channel, liquidity sweep, and accumulation phase. He had set his targets for upsides of $2, $5, $10, and $18 or more from the bottom end.

Source: X

The $2 area is the first bullish flip trigger in that setup. If the price drops below $0.70, the structure would become weak, but a price recovery to this level would support the initial price forecast for the APT.

Additionally, another analyst, Crypto with Gopal, has mentioned that APT is exhibiting a potential double bottom structure. He said that buyers were defending a key area, and there was strength building in a higher low after the second bottom.

A break above the neckline would validate a bullish reversal. APT is in an accumulation phase with an upside bias, and confirmation is key to the APT price prediction until that move occurs.

Source: X

Aptos Momentum Builds as RSI and MACD Improve

According to TradingView data, the Relative Strength Index (RSI) is at 68.09, with the RSI moving average at 61.00. The reading formed near the top of the neutral zone but remained below the 70 level that is typically seen for overbought situations.

The Moving Average Convergence Divergence (MACD) data indicates that the MACD line is at 0.048, the signal line is at 0.032, and the histogram is at 0.016. The MACD line stayed above the signal line, indicating positive momentum on the daily chart. 

Source: TradingView

APT price prediction now hinges on whether or not it’s able to withstand the lower accumulation floor and move the price up to $2. The current data shows stronger volume and weekly gains, but the analyst views still require a confirmed breakout.

This article contains market analysis and price predictions. These are not guarantees. Crypto markets are volatile. Always DYOR. Not financial advice.

Also Read: FLOW Price Eyes $0.0466 as Bullish Structure Signals Liquidity Move

Filed Under: Cryptocurrency News

ONDO Price Prediction: Bullish Breakout Signals Massive Rally Toward $1.08

By Sajjal Ali | Edited By Ammar Raza,May 12, 2026, 1:00 AM

ONDO price has broken out of a long consolidation phase, signaling strong bullish momentum supported by rising trading volume and renewed buyer interest. Meanwhile, Ondo Finance has expanded its ecosystem by enabling tokenized stocks and ETFs to bridge to Hyperliquid through LayerZero. According to CoinMarketCap, the ONDO price is standing at $0.4341 with a 24-hour gain of 5.47%.

ONDO current price

Source: CoinMarketCap

ONDO Price Breakout Signals Massive Rally Ahead

Furthermore, the crypto analyst Jonathan Carter highlighted that the ONDO price has confirmed a powerful breakout above its broadening wedge pattern on the daily timeframe, signaling renewed bullish momentum across the market. 

The breakout follows weeks of consolidation and has already delivered an impressive 71% rally from the previous accumulation zone. Rising trading volume and strengthening price action suggest buyers remain firmly in control.

ONDO price prediction

Source: Jonathan Carter’s X Post

Jonathan Carter is now watching key upside targets for the ONDO price at $0.54, $0.78, and the major psychological level of $1.08. 

A successful hold above the breakout zone could trigger another strong expansion phase for the ONDO price. Traders believe continued market strength may further accelerate ONDO’s bullish momentum in the sessions ahead.

Also Read: ONDO Price Prediction: Can Bulls Push the Token Toward $0.76 Resistance?

Technical Indicators Support Bullish Momentum

According to TradingView, the ONDO price has emerged with immense strength in a bullish breakout following a long period of consolidation sideways. 

The ONDO price moved upwards to $0.428 and managed to reclaim all its essential exponential moving averages. It is a significant structural shift in the market, whereby the previous resistance levels have become support levels.

ONDO technical analysis

Source: TradingView

The technicals suggest that the advance is running out of steam. The Relative Strength Index is at an overbought level of 79.20, suggesting that a retracement may be imminent. 

Although the up move remains intact, a retracement down towards $0.40 is a possibility. This would give some room for consolidation for the ONDO price before the next run at breaking above the psychologically important level of $0.50.

Ondo Brings Tokenized Stocks to Hyperliquid via LayerZero

Apart from the price movements, Ondo Finance has expanded its tokenized stock platform through bridging assets to the HyperEVM on Hyperliquid using LayerZero. 

Through this process, traders are able to take positions in tokenized stocks and exchange-traded funds from decentralized platforms, where traders can leverage spot trades with perpetual futures.

ONDO tokenized ETF expansion

Source: Ondo Finance’s X Post

With the token listing, the way is paved for advanced trading strategies, including basis trades and delta-neutral strategies, which can be employed by eligible perpetual contracts available on Hyperliquid. 

Companies like Melt Finance and Felix Protocol are among those that have been quick to integrate Ondo’s tokenized stock offerings and ETFs on their platforms.

This article contains market analysis and price predictions. These are not guarantees. Crypto markets are volatile. Always DYOR. Not financial advice.

Also Read: Ondo Finance Price Signals Breakout Toward Key $0.60–$0.65 Resistance

Filed Under: Cryptocurrency News, Altcoin News

XRP Bullish Signals Point to Potential Rally Toward $2

By Amrin Sanjay | Edited By Ammar Raza,May 11, 2026, 11:59 PM

XRP is flashing several bullish technical and on-chain signals that analysts believe could trigger a strong breakout rally toward the $2 mark. Over the past weekend, the crypto managed to climb by about 9%, while investors noted positive movements like funding rates, Bollinger Band compression, and bullish chart patterns.

Despite XRP currently being way lower than its record high of $3.66 recorded in July of last year, analysts claim the recent price behavior is similar to setups observed in previous rallies.

Funding Rates Hint at Potential Reversal

Among the best signs of a bullish move is the funding rate of XRP at Binance. As per analysis by Darkfost, the 30-day funding rate has remained bearish for almost three months, even as XRP has posted gains during the said period.

XRP's funding rates hint at potential reversal
Source: CyptoQuant

The funding rate is an ongoing payment among those trading long positions and short positions in the perpetual future market. When the funding rate is negative, it means that there is a high position for a downward move. When bearishness reaches a certain point, however, it might trigger a sudden rise in prices.

Darkfost noted that similar setups occurred earlier in 2025 before XRP experienced a strong rebound. In April 2025, XRP traded near $1.25 before eventually rallying over 120% during the following bullish recovery phase. Analysts say the prolonged negative funding environment could now create conditions for another short squeeze if bullish momentum continues building.

Also Read: XRP Price Analysis: Is a Macro Bottom Forming Near $0.93?

Bollinger Bands Signal Major Volatility Ahead

Bollinger Bands, another widely watched oscillator, have compressed to their lowest levels in just under 10 months, according to the XRP chart of the last two days. These bands are widely utilized for measuring price volatility and momentum. The compression of the bands is seen by many as a precursor to a significant price movement.

Based on historical patterns, there have been previous instances where the altcoin has surged due to such a squeeze. Following a Bollinger Bands breakout in July 2025, the altcoin rose by almost 90%. Similarly, in July 2024, it gained more than 70%, courtesy of a similar technical pattern.

XRPs Bollinger bands signal major volatility ahead
Source: TradingView

According to Analyst Seth, the present instance is part of the “tightest Bollinger Band squeeze in recent years,” and usually, such cases end up having explosive reactions.

Triangle Breakout Targets $2

XRP’s breakout from the symmetrical triangle formation on the daily timeframe is also being watched by the technical analysts. For some time now, the altcoin has been trading inside two lines converging against each other in a symmetrical triangle, which is normally considered a breakout formation. The token has now broken out to the upside by crossing the upper line, with $1.40 becoming potential support for it.

Should XRP manage to hold onto its breakout, there is an expectation that the altcoin could make its way towards the $2.05 price level. That would entail a potential upside of around 40% compared to present price levels.

XRPs triangle breakout targets $2
Source: TradingView

Technical indicators suggest increasing strength. A bullish crossover above the zero mark was generated by the Moving Average Convergence Divergence (MACD), an indicator often associated with more bullish momentum for the altcoin. According to analyst CW8900, a “full-scale rally” of XRP might just be underway following the token’s reversal at a multi-year support level.

This article contains market analysis and price predictions. These are not guarantees. Crypto markets are volatile. Always DYOR. Not financial advice.

Also Read: XRP Price Analysis: Break Above Resistance Opens $1.4700 Upside Target

Filed Under: Ripple (XRP), Altcoin News, Cryptocurrency News

SUI Price Jumps 50% After 108.7M Token Staking Transfer

By Amrin Sanjay | Edited By Ammar Raza,May 11, 2026, 11:30 PM

Sui recorded a sharp rally over recent days, with the token climbing nearly 50% following a major staking transfer and rising institutional activity. The move came as SUI Group Holdings shifted 108.7 million SUI tokens into direct staking, reducing liquid supply and drawing increased attention to the blockchain’s expanding ecosystem.

What’s behind $SUI’s recent +50% move? (Explored with Santiment MCP + Claude):
📈 Price: $0.92 baseline → $1.39 peak (May 10) → $1.26 now. Trading volume surged from $213M to $2.5B.
🔒 The trigger: SUI Group Holdings (NASDAQ: SUIG) transferred its entire 108.7M SUI treasury… pic.twitter.com/ayRd0eNZwD

— Santiment Intelligence (@SantimentData) May 11, 2026

SUI Rally Gains Momentum After Major Staking Move

In addition, the stock SUI witnessed its prices rise from about $0.92 up to $1.39 as it stabilized around $1.26. Moreover, during this time, the trading volume rose sharply from $213 million to about $2.5 billion. This rise was due to increased activities in the market in response to supply side events and catalysts.

SUI rally gains momentum after major staking move
Source: Santiment

One of the catalysts for the surge was when SUI Group Holdings decided to stake all 108.7 million SUI held in its treasury. As a result, 2.7% of the token’s circulating supply was taken out of circulation. The move had more effect since there were already 74% of the tokens staked.

Also Read: Will SUI’s Default Privacy Model Strengthen Web3 Payments in 2026?

Reduced Liquid Supply Supports Price Action

Decrease in availability of liquid supply was one of the factors that facilitated an upward surge in the value of the token. This is because locking up many tokens in staking reduces the total number of assets that are available for trading. This can tighten market conditions and increase sensitivity to new buying demand.

While most rallies tend to be based on retail hype, the most recent rally by the token seemed to be very closely related to institutional activity and treasury management.

According to information from on-chain analytics, there was no unusual surge in dominance in social media at the time of the price surge. Analysts noted that the absence of excessive retail enthusiasm could indicate a more structurally driven rally rather than a short-term speculative surge.

CME Futures and Paga Partnership Add Catalysts

Another source of additional momentum has been the news that CME Group will be listing SUI futures contracts on May 29. The token’s listing of futures contracts would mean that it is among the few layer-1 blockchain projects that have futures access on a leading exchange platform. Futures products are often viewed as a sign of growing institutional recognition and market maturity.

A further factor that may have influenced the rise in cryptocurrency prices was the reported partnership between the token and Paga for cross-border payments in Africa.

This partnership seeks to extend the reach of blockchain-based payment systems into developing nations. Such partnerships may strengthen the blockchain’s real-world utility narrative beyond speculative trading activity.

Institutional Activity Shapes Market Sentiment

However, it was noted by some market analysts that institutional staking activity would have a different impact on the token as compared to retail momentum. Massive treasury investments towards staking would mean reduced trading volume for the token as well as increased commitment from ecosystem members. This can create stronger support levels during periods of market volatility.

On the other hand, some analysts were concerned about the potential for the token to sustain momentum, which would be contingent on more growth within its ecosystem and users adopting the protocol.

Various factors, such as staking yields, derivatives adoption, and network activities, might determine whether the recent gains of the token can be sustained. As institutional participation increases, on-chain metrics may become increasingly important in evaluating price trends.

This article contains market analysis and price predictions. These are not guarantees. Crypto markets are volatile. Always DYOR. Not financial advice.

Also Read: SUI Price Analysis: Bulls Target $1.30 as Rally Gains Momentum

Filed Under: Cryptocurrency News

  • « Go to Previous Page
  • Page 1
  • Interim pages omitted …
  • Page 30
  • Page 31
  • Page 32
  • Page 33
  • Page 34
  • Interim pages omitted …
  • Page 3615
  • Go to Next Page »

Primary Sidebar

Recent Posts

  • Solana Price Eyes $97 Resistance as UNI Launch Boosts DeFi Momentum May 22, 2026
  • Iran Crypto Holdings Hit $7.7B as US Freezes $500M May 22, 2026
  • Bitwise Stakes $19.7M in HYPE After ETF Wallet Reveal May 22, 2026
  • Boerse Stuttgart, Societe Generale & flatexDEGIRO Partner for Tokenized Securities Platform May 22, 2026
  • JASMY Price Breakout Above Weekly High Could Trigger Strong Rally to $0.27 May 22, 2026

Footer

News

  • Latest News
  • Altcoin News
  • Bitcoin (BTC)
  • Blockchain
  • Tron (TRX)
  • World

Digest

  • Meet the Founder
  • Price Winning Article
  • DeFi
  • Cyber Security
  • Crypto Scam

Industry

  • Project Review
  • Technology
  • Fintech
  • Tron Exchange
  • New in Town

Tron Universe

  • Event and Tron Parties
  • New in Town
  • Tron Tokens

FOLLOW US

  • Facebook
  • Telegram
  • Twitter
  • Linkedin

Editorial Policy | Privacy Policy | Disclaimer | Terms and Conditions | Masthead

Copyright © 2026 · Tron Weekly. All Rights Reserved. NOTE: Tron Weekly is an independent crypto news site that adheres to the strict journalism policy anchored on transparency, trust, and objectivity, we have no affiliation with the TRON Foundation, its founder Justin Sun or any other cryptocurrency firm.