Ethereum price analysis shows traders are watching a narrow breakout zone as leverage cools across derivatives markets, as of May 11, 2026. ETH remains near key resistance after weeks of range-bound action, while funding data signals a shift in positioning before the next market move.
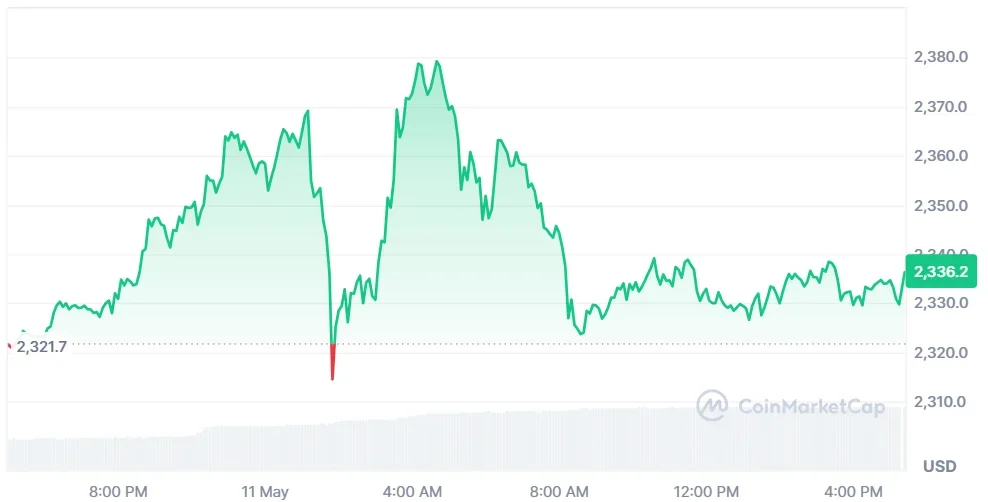
As of writing, Ethereum (ETH) is trading at $2,337.88, showing a 0.54% uptick in the past day. The trading volume is showing a strong bullish surge up 95.86% and is currently standing at $21.54 billion. Over the last week, the coin price has decreased by 0.17%, as per CoinMarketCap.
Also Read: BlackRock Expands Tokenized Treasury Fund Initiative on Ethereum in 2026
Ethereum Price Analysis Shows Derivatives Cooling
Analyst Darkfost pointed out that the derivatives activity of Ethereum has waned ahead of a potential breakthrough. The analyst noted that ETH has moved between $2,250 and $2,450 for nearly one month. This consolidation occurred after a rally of approximately 33% above the February low.
Additionally, the Ethereum price analysis reveals that open interest grew during this rebound. Darkfost stated that during the move, Ethereum’s open interest rose by approximately $4.5 billion. The increase reflected a robust rebound in derivatives trading as traders took on new exposures.
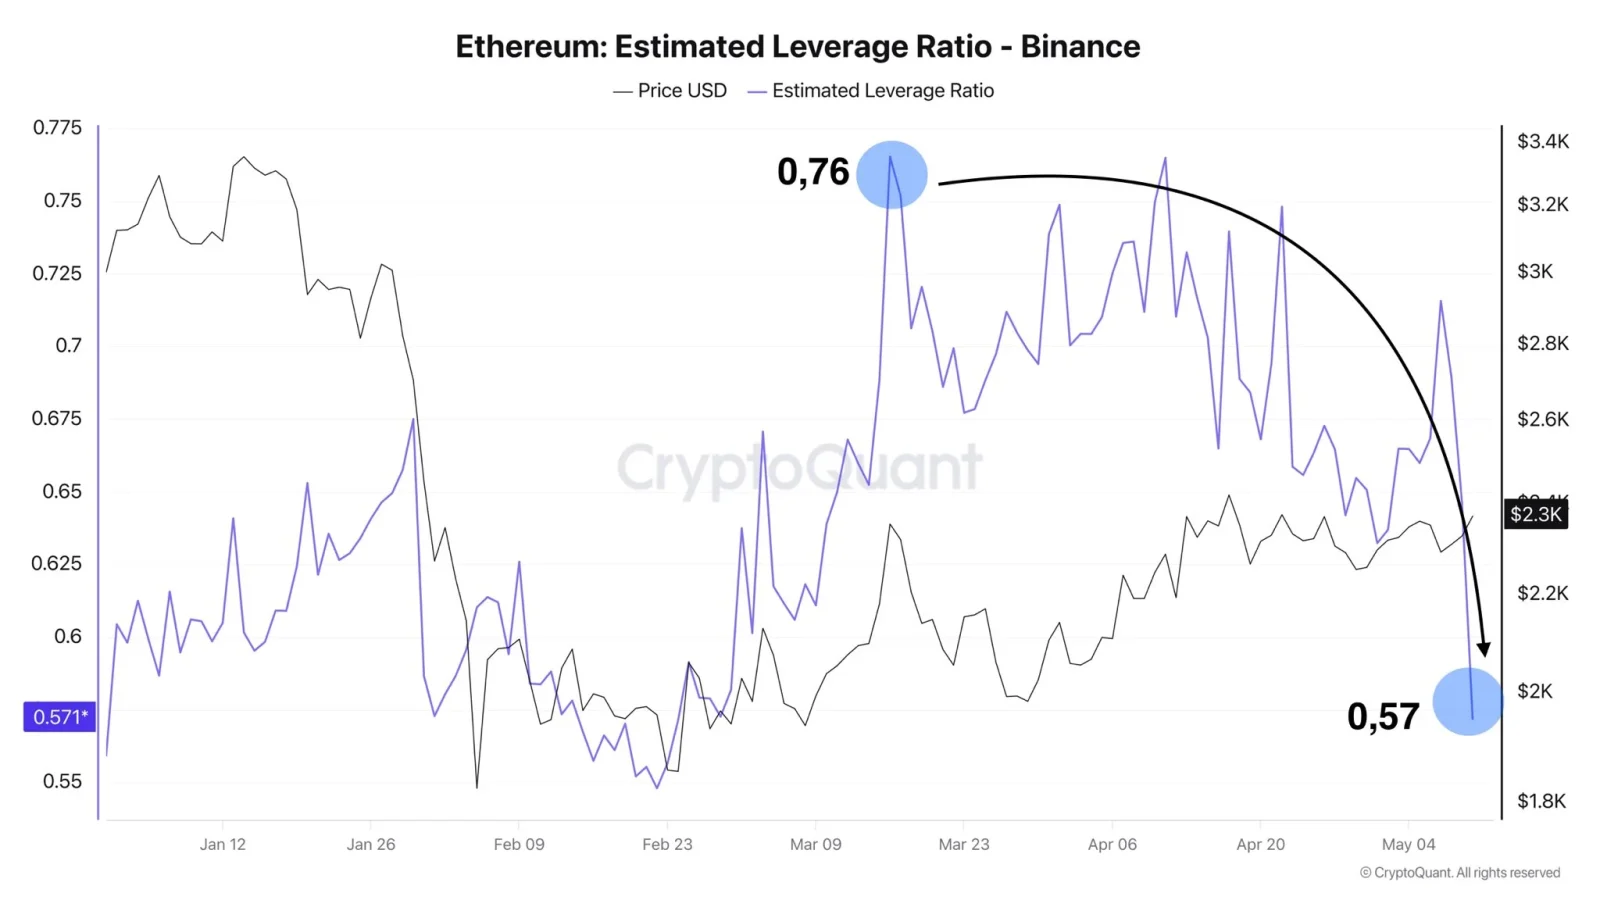
The leverage build-up was clear on Binance. The highest estimated leverage ratio seen by ETH on Binance was 0.76 on March 16. That was the level that exhibited quicker leveraging activity throughout the rally.
The funding rates remained largely negative over the same period. This showed that many investors remained positioned bearishly. The market condition was mixed as recovery was seen for ETH while traders remained heavy on the move.
ETH Tests $2,450 as Leverage Ratio Declines
Ethereum price analysis now points to a change in that setup. The leverage ratio of ETH on Binance has fallen significantly to 0.57. The decline came as the token again tested the $2,450 resistance level.
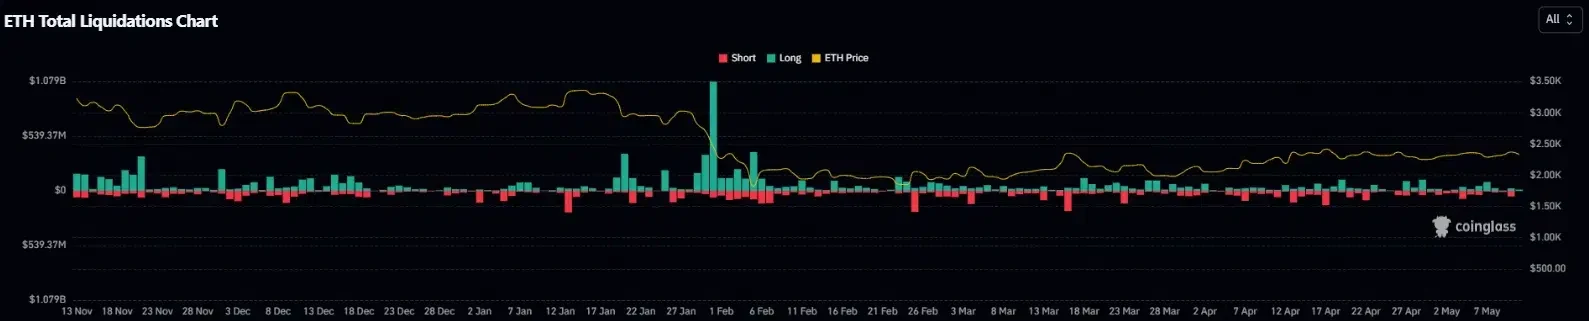
Funding rates have also turned mostly positive. This indicates that long positions are back in control. Darkfost attributed that leverage reduction to position liquidation on both sides of the market.
There were some long closures as ETH reversed back to $2,350. During the rally, short positions were also closed or liquidated. The analyst said this does not need to be viewed as a bearish signal.

Reducing leverage is one way to decrease unexpected market stress. It could also help to build a more solid base as ETH attempts to surpass its range. However, there might be a need for some spot demand to create a breakout.
Volume and Open Interest Rise
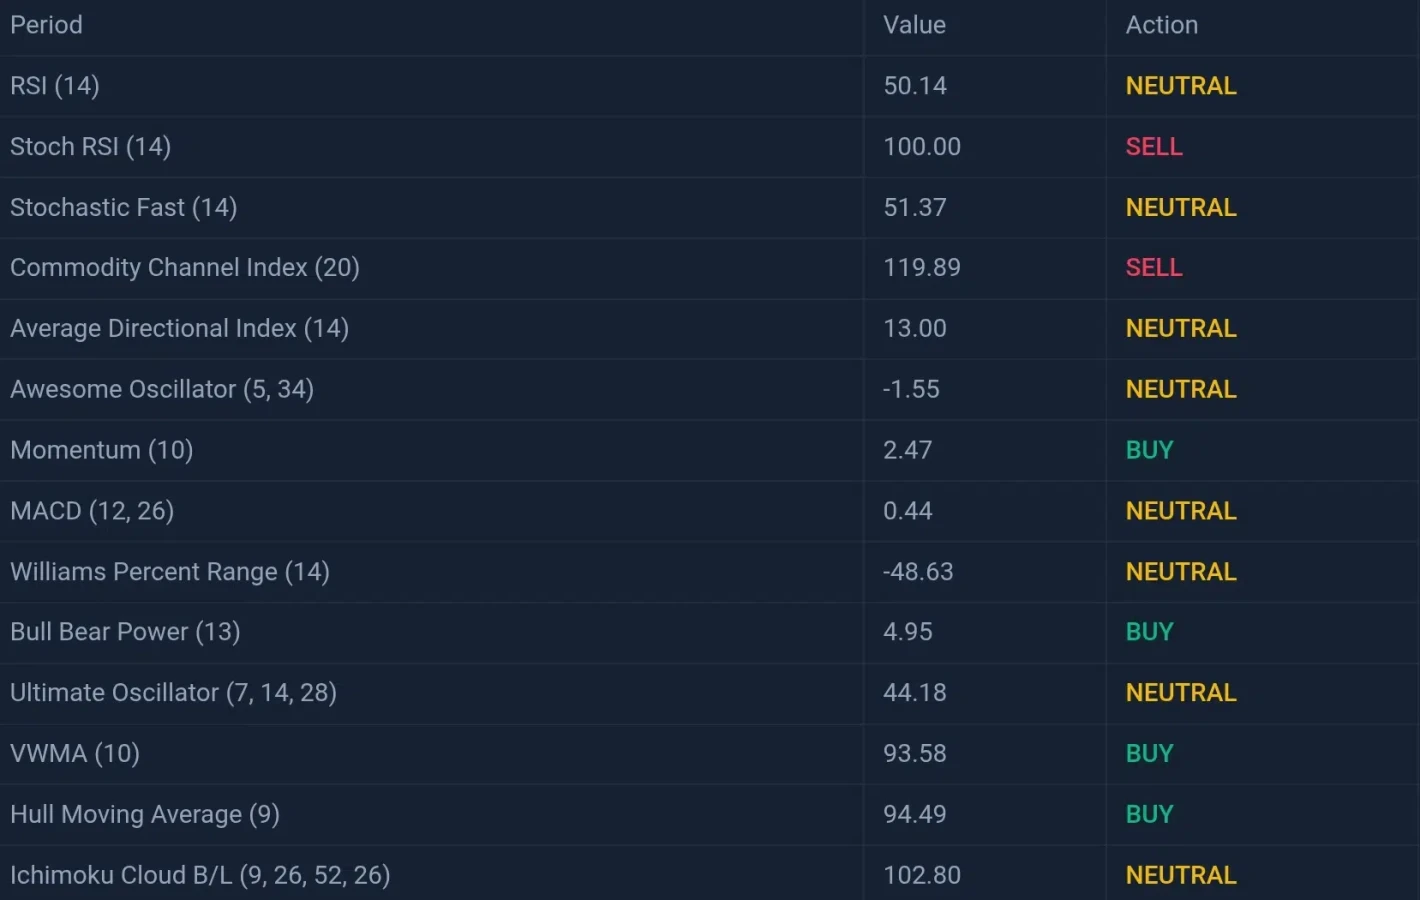
CoinGlass data has added more details to the Ethereum price analysis. The future volume jumped 117.72% to $47.09 billion. Open interest rose by 0.64% to $33.29 billion, while the ETH OI-weighted funding rate was 0.0045%.

In the past 24 hours, total liquidations added up to $91.64 million. Long liquidations amounted to $35.60 million, and short liquidations totaled $56.05 million. Ethereum price analysis suggests the next major move depends on resistance and spot demand.
This article contains market analysis and price predictions. These are not guarantees. Crypto markets are volatile. Always DYOR. Not financial advice.
Also Read: SUI Price Analysis: Bulls Target $1.30 as Rally Gains Momentum