The latest AAVE price gained momentum as DeFi lending protocol Aave recorded a strong rise in activity after Token Terminal reported that deposits on Aave v4 running on Ethereum surpassed $50 million.
The figure marked nearly 100% growth over the past month, reflecting renewed participation across decentralized finance markets.
The trading community is slowly turning towards DeFi protocols due to positive sentiment around cryptocurrency. Increased deposits indicate greater confidence in on-chain lending and liquidity services.

Source: Token Terminal
Moreover, the rising trend is taking place amid AAVE trading close to significant support levels following a prolonged bearish period. Increasing deposits may lead to Aave’s dominance among Ethereum-based lending platforms as liquidity returns to the ecosystem.
Also Read: NEAR Price Prediction: Technicals and Derivative Data Point to Bullish Reversal
Judge Clears $71 Million ETH Transfer to Aave
Another piece of news regarding Arbitrum has gained prominence this week. A US federal court judge from the state of Manhattan has approved moving 30,766 ETH ($71 million) to Aave LLC due to the Kelp DAO exploit in April.
The court judge, Margaret Garnett of the Southern District of New York, gave the order on Friday after amending a restraining order that had placed the funds under restriction since May 1.
Following a filing from Aave via Morrison Cohen LLP, they wanted the injunction to be vacated or for the parties involved to pay a bond of $300 million. This request wasn’t granted, but there was a little modification to the original order.
It was further ruled that any member of Arbitrum’s governance who votes during the governance poll and the transfer process would not be violating the restraining order.
On the same day, before the ruling, members voted for the proposal, garnering 182.2 million ARB tokens or 91% of the vote share.
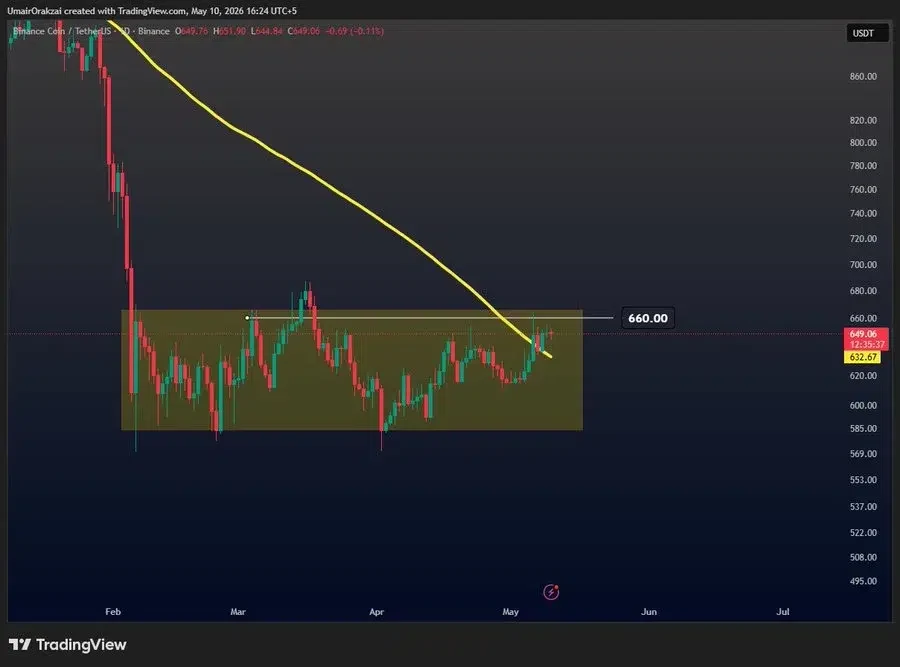
AAVE Price Structure Signals Possible Breakout
The AAVE price is currently being tracked by technical experts because the crypto has been trading at the upper levels of the established downward channel on the daily chart.
This trend has been observed in the last few months, where the cryptocurrency has been registering new lows along with a decline in its highs. However, the current consolidation near the $95-$100 range is expected to attract more buyers.

Source: X
It was observed that the level of selling pressure from the sell side declined during the pullback period; this suggests that sellers might be exhausted. The Aave price chart now appears to form a rounded bottom; it indicates that the reversal process has commenced.
The key resistance for the pair remains between $120 and $130. In case the Aave price level manages to cross this resistance level, the bearish trend will become less powerful and may head towards $200.
This article contains market analysis and price predictions. These are not guarantees. Crypto markets are volatile. Always DYOR. Not financial advice.
Also Read: Chainlink Price Prediction: LINK Signals Recovery as $10 Zone Reclaims Momentum