• Skip to primary navigation
  • Skip to main content
  • Skip to primary sidebar
  • Skip to footer
  • About TronWeekly
  • Write for us
  • Terms and Conditions
  • Privacy Policy
  • Disclaimer
  • Contact
  • All Posts
  • Advertise

TronWeekly

Crypto World News

  • Home
  • Latest News
  • Opinion
    • Education
    • Best TRON Wallets
    • Beginner’s guide to TRON
    • Tron Tokens
    • Market Analysis
  • Industry
    • Tron Exchange
    • Project Review
  • Press Release
  • Bitcoin (BTC)
  • Ripple (XRP)
  • Advertise
  • About TronWeekly
    • The Team
    • Editorial Policy
    • Write for us
    • Privacy Policy
    • Disclaimer
    • Terms and Conditions
    • Contact
You are here: Home / All Posts

All Posts

Avalanche Price at $10.12 Surges Amid Avalanche Ecosystem Boom

By Athulyamol VS | Edited By Messam Raza,May 15, 2026, 5:00 AM

Avalanche Price is experiencing new bullish momentum as ecosystem growth continues to improve and technical indicators, along with trader interest, are beginning to build back into the market.

Avalanche is a Layer 1 blockchain platform that provides fast transactions, is scalable, and supports DeFi, gaming and NFTs. The Avalanche project is developing its ecosystem through partnerships, and there seems to be increasing developer activity, which has helped create a positive market sentiment. At press time, Avalanche Price is trading at $10.12 with an increase of 3.69% over the past 24 hours.

Avalanche Price Remains Above Support of $9.88

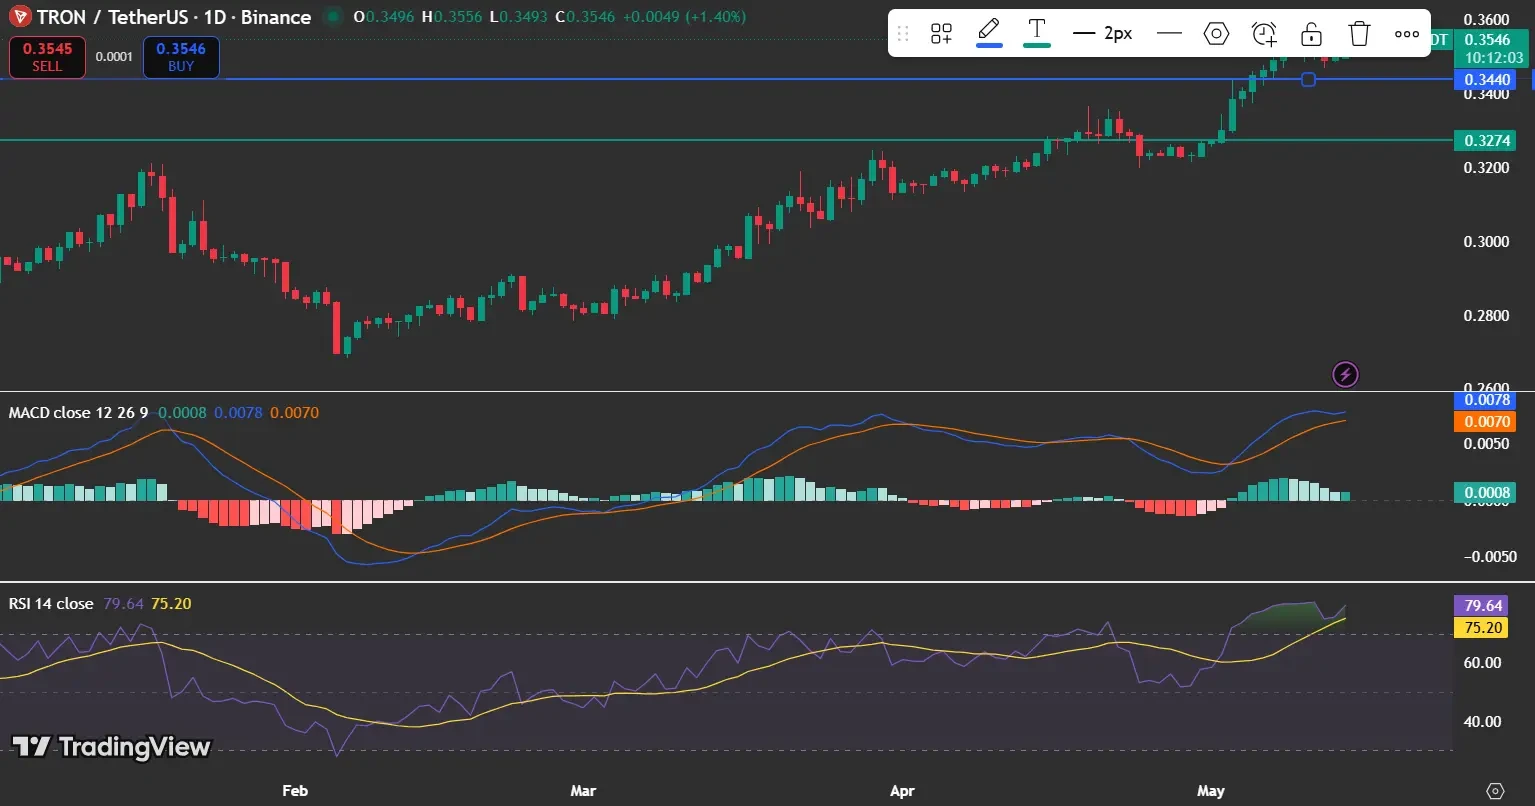
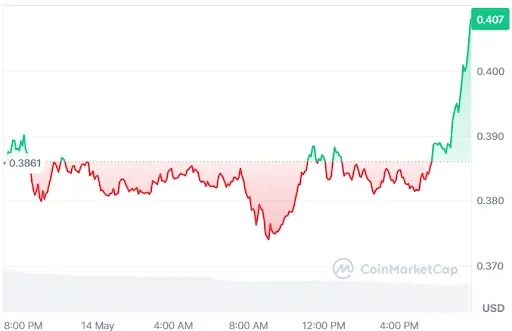
According to the TradingView chart, it appears that the Avalanche is bouncing back after a period of downside pressure. The chart reveals that AVAX is holding above the key support level ($9.88) and gaining momentum above the psychological $10 barrier.

Bollinger Bands reflect increasing volatility, potentially preparing for an imminent significant price move. The 20-day moving average (approximately $9.52) is currently acting as short-term support, while the key breakout level ($10.29) is currently acting as significant resistance.

If buyers can continue to show momentum, Avalanche Price could potentially reach higher resistance levels over the next few trading sessions.

AVAX price analysis
Source: TradingView

Also Read: AVAX Price Prediction: Drastic 1.56% Rally Ahead

Avalanche Price Strength Grows After Ecosystem Update

Avalanche strength also grew following an Avalanche ecosystem update shared on the official Avalanche account via social media.

The update mentioned all of the growth that has occurred within the Avalanche Network, including gaming, DeFi lending, payments, NFTs, and DEXs.

In this update:

3 DEXes
2 gaming updates
1 mobility L1
1 streaming platform
payments, NFTs, infra, student outreach, and DeFi lending

Avalanche is built for it. 👇 https://t.co/Cy2WRgrFC7

— Avalanche🔺 (@avax) May 14, 2026

This update shows that the network is still being developed and has seen more participation in the ecosystem than in previous years, which could create more long-term confidence among AVAX investors.

Avalanche Price has been showing signs of recovery due to both technical strength as well as ecosystem expansion, creating a positive outlook on the token. Even though the price has been volatile recently, traders will likely continue to watch resistance levels closely for confirmation of a larger breakout.

Also Read: Avalanche (AVAX) Price Eyes $11 Bounce as Breakout Range Nears

Filed Under: Cryptocurrency News, Avalanche (AVAX)

SHIB Price Analysis: Falling Wedge Breakout Hints at 6x Move to $0.000030

By Sajjal Ali | Edited By Messam Raza,May 15, 2026, 4:00 AM

Shiba Inu (SHIB) breakout from a falling wedge pattern signals potential bullish momentum for the SHIB price, supported by improving RSI and MACD indicators. However, declining open interest and trading volume suggest traders remain cautious despite expectations of a possible strong rally ahead. According to CoinMarketCap, SHIB is trading at $0.000006437 with a daily gain of 2.49%.

SHIB price prediction

Source: CoinMarketCap

SHIB Derivative Data Points to Reducing Potential

According to Coinglass, the SHIB open interest declined by 8.82%, bringing the total to $59.96 million. The reduction in open positions suggests that traders are closing contracts or reducing exposure, reflecting weaker confidence and a more cautious approach toward maintaining positions in the current market environment.

SHIB open interest and volume

Source: Coinglass

Trading volume also dropped by 17.13%, reaching $120.47 million. The decline in overall market activity indicates lower participation from investors and traders, which may signal slowing momentum and reduced enthusiasm.

Also Read: Shiba Inu (SHIB) Price Analysis: Falling Wedge Pattern Signals Potential Breakout

SHIB Price Breakout Signals Massive 6X Rally

Furthermore, the crypto analyst Javon Marks highlighted that the SHIB price is receiving another wave of bullish attention after escaping the confines of a falling wedge pattern, which is an indicator that usually marks a reversal in the crypto market. 

The escape from the falling wedge pattern, according to experts, suggests that buying momentum is gaining traction amid reduced selling pressure.

SHIB price prediction

Source: Javon Marks’ X Post

The latest occurrence in a similar trend witnessed a blowout move that increased the SHIB price by about 6x and reached its peak at around $0.000030. 

However, the current market trend seems to suggest that an even greater move for the SHIB price might occur, as an alt season is expected to arrive soon, and SHIB will benefit from the new influx of investors, trading volumes, and momentum.

Momentum Indicators Support Upward Potential

According to TradingView, the RSI has swung to neutral momentum with an RSI value of 52.94. Consistent movement above the signal line indicates an increasing trend of buyers’ momentum after a long period of decline. 

The SHIB price has managed to lose its oversold condition, suggesting that the previous bearish sentiment has started to stabilize.

SHIB technical analysis

Source: TradingView

The MACD indicator confirms the recovery trend by displaying a series of increasing histogram bars colored green. Both the MACD and signal lines rise towards the zero point, indicating that there is an accumulation of positive momentum. 

This scenario suggests that the market is exiting its extended bearish trend into a period of consolidation or recovery.

This article contains market analysis and price predictions. These are not guarantees. Crypto markets are volatile. Always DYOR. Not financial advice.

Also Read: SHIB Price Ascending Triangle Signals Rally Toward $0.00000760 Resistance Ahead

Filed Under: Cryptocurrency News, Shiba Inu (SHIB)

Ethereum Price Holds Above $2,300 as Institutional Demand Grows

By Zagham Abbas | Edited By Ammar Raza,May 15, 2026, 3:18 AM

Ethereum price remained stable despite rising market selling pressure, showing resilience as fresh capital continued flowing into the network. Analysts believe Ethereum could maintain its strength if buying activity and institutional demand continue, even as the broader crypto market experiences uncertainty and short-term volatility.

At the time of writing, ETH is trading at $2,316.20, up 2.08% over the last 24 hours. The ETH recorded a daily trading volume of $24.12 billion, while its market capitalization reached $277.94 billion. The recovery in the Ethereum price has attracted attention from analysts who believe the asset could maintain strength if buying activity continues.

Ethereum Price chart

Source: CoinMarketCap

Also Read | Nvidia Hits $5.4 Trillion Market Cap as Jensen Huang Joins Trump on ChinaTrip

Ethereum ETF Demand Keeps Rising

On May 14, 2026, a crypto analytics firm, Alphractal, highlighted that Ethereum’s “Realized Cap Impulse” indicator remained positive despite the downturn in the market. The firm noted that despite Ethereum’s 3% drop and trading at levels close to $2,301, net new funds continued flowing into the network.

Ethereum ETF Demand Keeps Rising

Source: Alphractal’s X Post

According to Alphractal, the positive trend of the realized cap implies further accumulation during weak periods from investors. Furthermore, according to the publication, large investment bank Jane Street has increased its Ethereum ETF position by almost $82 million in the first quarter of the year, while at the same time decreasing exposure to Bitcoin and MicroStrategy positions.

Ethereum Price Tests Critical Support

From the perspective of technical indicators, it is believed that the price of Ethereum could still encounter some short-term selling pressures before making a new attempt for a breakout to the upside. The RSI reading is now 49.94, just a bit lower than the 50 reading, while its moving average still holds steady at 52.88.

Ethereum Price Tests Critical Support

Source: TradingView

Meanwhile, the MACD technical analysis tool is now indicating less momentum. The MACD line is now at 8.29, which is lower than the signal line, which is at 17.92. The histogram is still negative at -9.63.

With more selling pressure, the price of Ethereum will test support around its 50-day moving average at $2,247. Nevertheless, institutional demand and continuous capital flow in the blockchain platform can allow Ethereum to sustain itself in case there is an improvement in the broader cryptocurrency market environment.

This article contains market analysis and price predictions. These are not guarantees. Crypto markets are volatile. Always DYOR. Not financial advice.

Also Read | Bitcoin Holds Above $80K as US 10Y Yield Reaches 4.4%

Filed Under: Cryptocurrency News

TRON Price Surges to $0.3546: 4 Optimistic Signs Supporting the Rally

By Athulyamol VS | Edited By Ammar Raza,May 15, 2026, 3:00 AM

TRON Price technical indicators are showing strong bullish momentum in TRON, which is helping to boost the overall level of confidence for investors in holding TRON.

TRON (TRX) gained traction again, as it not only has registered continued strength on its daily chart, due to positive technical indicators, but is also garnering attention from a wider audience in relation to the broader crypto ecosystem after receiving an enforcement update from the TRON ecosystem.

This has also provided a sense of increased confidence in the market concerning the TRON Price in the near term. At press time, TRON (TRX) is trading at $0.3546 with an increase of 1.40% over the past 24 hours.

TRON Price Signals Bullish Strength

As evident on the TradingView chart, after breaking through the $0.34 resistance level, TRX continues to trend upward and has a strong bullish momentum as reflected by the RSI, which is currently at nearly 79.

However, despite a slightly weakening momentum of the MACD, the MACD is still in bullish territory. In addition, prices remain above the critical support level of $0.327. This clearly indicates that the buyers are still in control of this market structure, supporting the ongoing TRON Price rally.

TON price analysis
Source: TradingView

Also Read: TRON (TRX) Builds Strength Above $0.32 as Bulls Stay Active

TRON Price Gains Confidence From T3 FCU Update

Recently, TRON DAO also noted the major historic milestone of the T3 Financial Crime Unit (T3 FCU) (the enforcement arm of Tether and TRM Labs) freezing a total of over $450 million in illicitly obtained digital assets on a global level.

The TRON account stated, “Protect users. Fight crime.” This has provided additional confidence in TRON’s ongoing efforts to provide a more secure ecosystem and improve the overall regulatory environment concerning TRON projects, which many traders consider to be a positively influencing long-term factor for TRON Price sentiment.

Over $450M in illicit assets frozen through coordinated enforcement.

Protect users. Fight crime. https://t.co/dSLTKxcDKQ

— TRON DAO (@trondao) May 14, 2026

Despite the current bullish trends of TRON being viewed favourably by both technical sets of indicators and by continued positive developments within the project itself, including its ecosystem.

TRX could see further upside potential towards its $0.36 resistance level; this could happen in the near future if there is continued strong buying momentum supporting TRON Price.

The current state of volatility throughout the cryptocurrency market is significantly affecting how far TRX could reach regarding where it trades; therefore, it is difficult to predict with complete certainty where price action could lead next for TRON Price.

This article contains market analysis and price predictions. These are not guarantees. Crypto markets are volatile. Always DYOR. Not financial advice.

Also Read: TRX Price Analysis Shows Breakout Above $0.336 Resistance

Filed Under: Cryptocurrency News

Hyperliquid Expands USDC Support Through AQAv2 Upgrade

By Amrin Sanjay | Edited By Ammar Raza,May 15, 2026, 2:30 AM

Hyperliquid has announced a major update to its stablecoin infrastructure by expanding support for USDC through the AQAv2 upgrade. The move includes Coinbase becoming the treasury deployer for USDC on Hyperliquid, while Circle will manage the technical deployment for cross-chain infrastructure. The update is aimed at improving liquidity, reducing fragmentation, and strengthening stablecoin utility across the network.

Coinbase has announced its plan to activate AQAv2 on USDC as the treasury deployer, with Circle serving as the technical deployer responsible for CCTP and native cross-chain infrastructure. Both Coinbase and Circle have committed to stake HYPE to activate AQAv2. As part of this…

— Hyperliquid (@HyperliquidX) May 14, 2026

Coinbase and Circle Take Key Roles in AQAv2

According to the AQAv2 model, Coinbase is going to be the treasury deployer for USDC in Hyperliquid. The task of Coinbase as treasury deployer will be to facilitate reserve deployment and receive a significant share of reserve yield revenue. Circle, on the other hand, will be responsible for deploying the technical aspects of reserve management, including Cross-Chain Transfer Protocol (CCTP).

Coinbase and Circle take key roles in AQAv2 in Hyperliquid
Source: Coinbase

This is a big step forward for Hyperliquid, as it seeks to make USDC a leading aligned stablecoin in their network. Both Coinbase and Circle have pledged to stake their HYPE tokens to kick-start the AQAv2 platform. This collaboration clearly indicates an increasing trend among institutional players to get involved in decentralized trading.

Also Read: Hyperliquid ETF Debuts on Nasdaq With $1.2M First-Day Inflows

USDC Set to Become Core Quote Asset on Hyperliquid

In addition, as part of the network upgrade, the canonical outcome markets will start quoting USDC. Such a measure is likely to make markets more efficient and provide users with a more consistent trading experience. According to Hyperliquid, one of the key challenges that users and builders face on the platform is the fragmentation of liquidity.

The plan is to consolidate liquidity in USDC to facilitate trading within the network without using different stablecoins. This will also ensure efficient use of capital and better liquidity pools. It is worth noting that this initiative will bring Hyperliquid in line with other standards in the crypto market since USDC is among the popular stablecoins.

USDH Transition and AQAv2 Development

The AQAv2 iteration is founded on the learnings from USDH, which was the first stablecoin ever built to earn yield for a protocol and was implemented entirely via an on-chain process. Hyperliquid admitted that the technological breakthroughs brought about by Native Markets in USDH had played a big role in the creation of the AQAv2 system. While USDH may be phased out eventually, its legacy will remain.

The Native Markets company also reached an agreement on conditions that allow the USDH brand assets to be bought by Coinbase. Hyperliquid stated that, during the migration process, the USDH will continue being fully collateralized, meaning users can exchange their coins into USDC or any other fiat currency without having to pay any fees.

Hyper Foundation Announces Builder Support Grants

The Hyper Foundation will provide grants to builders and deployers associated with the USDH ecosystem to ensure smooth sailing during the migration process. This would include HIP-3 deployers, HIP-1 deployers, and projects that adopted USDH in their products or services. The purpose of these grants is to facilitate the adjustment of infrastructure and further development of Hyperliquid.

The foundation said the initiative is an indication of the company’s dedication to aiding developers who build in this ecosystem. The help will ensure that HYPE continues engaging with developers as it seeks to expedite the adoption of AQAv2. It also indicates the rising competition among blockchain networks to provide stablecoin architecture and settlement systems.

Also Read: Hyperliquid ETF Filing by Grayscale Adds Staking Feature for HYPE Investors

Filed Under: Altcoin News, Cryptocurrency News

INJ Price Breakout Targets $51 as MACD Signals Strong Bullish Reversal

By Sajjal Ali | Edited By Ammar Raza,May 15, 2026, 2:00 AM

Injective (INJ) has broken above key resistance, shifting into a potential uptrend. Technical indicators like a bullish MACD crossover and strengthening moving averages support rising momentum for the INJ price, while declining open interest and volume reflect reduced participation and cautious sentiment despite the improving price structure. According to CoinMarketCap, INJ is trading at $5.16 with a daily loss of 3.52%.

INJ current price

Source: CoinMarketCap

INJ Derivative Data Point to Declining Strength

According to Coinglass, the INJ open interest declined by 10.96%, reaching $114.18 million, indicating fewer active derivative contracts held by traders. This suggests reduced market participation, lower speculative positioning, and a possible shift toward caution or profit-taking.

INJ open interest and volume

Source: Coinglass

Trading volume decreased by 28.88%, falling to $748.79 million, reflecting reduced market activity and weaker participation among traders. This decline suggests lower liquidity, diminished momentum, and less aggressive trading behavior compared to prior periods.

Also Read: Injective Price Rises as USDC and CCTP Go Live on Injective Network

INJ Price Eyes $51 Rally as MACD Turns Bullish Again

Furthermore, the crypto analyst Javon Marks highlighted that the INJ gains attention as it forms a positive MACD crossover on the higher timeframe chart.

This technical trigger usually denotes a change in the atmosphere, where there’s a decline in selling activity, allowing buyers to start taking control again. For traders, this is often seen as an early indicator of an impending change in trend direction for the INJ price.

INJ price prediction

Source: Javon Marks’ X Post

A crossover like MACD in Injective historically suggested an explosive move of more than 3,600%, driving the price to the $51 mark. Although no guarantees exist, such a similarity is prompting speculation regarding another positive surge for the INJ price.

Even though experts warn that any proof should come from trading volumes and movements in price, momentum traders keep a close watch.

Technical Indicators Point to Strong Upward Momentum

According to TradingView, INJ price is exhibiting a strong breakout pattern on the upside. The price had formed a base near the $2.80 level in the month of March, which then rallied up steadily before breaching the 200-day EMA level at $5.08. It is currently trading near the $5.24 area after making a trend reversal.

INJ technical analysis

Source: TradingView

The technical indicators continue to provide strength to the bullish trend. The MACD indicator forms large bars in green colors while the MACD blue line is clearly crossing above the orange signal line.

On the other hand, the shorter-term EMAs remain dispersed below the price action in an effort to support a further price rise.

This article contains market analysis and price predictions. These are not guarantees. Crypto markets are volatile. Always DYOR. Not financial advice.

Also Read: Injective Price Prediction: INJ Bullish Breakout Targets $5.50 Resistance

Filed Under: Cryptocurrency News, Altcoin News

Bitcoin Tops $80K Ahead of US Senate CLARITY Act Vote

By Amrin Sanjay | Edited By Ammar Raza,May 15, 2026, 1:30 AM

Bitcoin climbed above the $80,000 level as the broader cryptocurrency market gained momentum ahead of discussions surrounding the proposed CLARITY Act in the United States Senate. The move added renewed optimism across digital asset markets, with traders closely watching how potential regulatory developments could influence institutional participation and market sentiment.

Bitcoin Reclaims $80,000 Amid Market Momentum

Bitcoin crossed the $80,000 mark after several sessions of steady upward movement in the crypto market. Market data showed increased buying activity during the rally, while the overall crypto market reportedly added nearly $30 billion in value within a few hours. Ethereum and several major altcoins also posted gains during the same period.

Bitcoin reclaims $80,000 amid market momentum
Source: Binance

The recovery above $80,000 comes after weeks of mixed price action influenced by macroeconomic uncertainty and changing investor sentiment. Analysts noted that Bitcoin’s resilience near key support levels helped strengthen bullish momentum. The move also reflected growing confidence among traders despite ongoing volatility in global financial markets.

Also Read: Bitcoin Price Outlook: $76,527 Becomes Crucial Level for Next Market Move

CLARITY Act Discussions Draw Attention From Crypto Markets

Investor attention shifted toward developments surrounding the CLARITY Act, which is being discussed by lawmakers in the United States. The proposed legislation aims to provide clearer regulatory guidelines for digital assets and define oversight responsibilities between financial regulators. Market participants believe clearer rules could improve confidence among institutions and retail investors.

The crypto industry has long pushed for regulatory clarity in the United States, arguing that uncertainty has slowed innovation and investment. Supporters of the bill believe standardized regulations could help expand adoption while reducing compliance confusion for blockchain companies.

Institutional Interest Continues to Support Bitcoin

Institutional demand has remained one of the major drivers supporting BTC’s recent recovery. Several asset managers and financial firms continue expanding their exposure to digital assets through exchange-traded products, custody services, and blockchain-related investments.

The growing role of institutions has contributed to increased liquidity and market maturity over the past year. Market observers say BTC’s ability to maintain higher price levels during periods of macroeconomic pressure reflects changing investor behavior.

Earlier market cycles often saw stronger selloffs during rising interest rates or economic uncertainty. However, recent trading patterns suggest Bitcoin is increasingly being viewed as a long-term digital asset rather than a purely speculative instrument.

Also Read: Bitcoin Holds Above $80K as US 10Y Yield Reaches 4.4%

Filed Under: Bitcoin (BTC), Cryptocurrency News

XRP Price Prediction: Will XRP Hit $1.50 in May Amid CLARITY Act Buzz?

By Athulyamol VS | Edited By Ammar Raza,May 15, 2026, 1:00 AM

XRP Price returns to focus amid regulatory optimism and bullish technical signals. Renewed conversation around crypto regulations, as well as a number of bullish technical indicators, have brought XRP into the public eye again after sitting on the sidelines for several weeks.

Recent developments may have changed the momentum in favor of buyers as it relates to XRP, which has been consolidating around its current price level. At press time, XRP was trading at $1.4463, recording a 1.33% increase over the past 24 hours.

Also Read: Advantages of XRP: 4 Billion Transactions in 5 Seconds

XRP Price Gains Attention Amid Key Technical Setup

According to the data from TradingView, XRP Price remains above support in the $1.40 region and has attempted (but has not been successful) in holding above the $1.45 resistance level. Additionally, the RSI (relative strength index) remains just below 55, which indicates that momentum is moderately bullish but that XRP has yet to enter the overbought range.

XRP price currently trades below the 200-day moving average near $1.73; thus, the market will require further evidence of a more sustained bullish trend in order for prices to break out higher.

After several months of declining prices, XRP appears to finally be stabilizing based on its daily chart. Buyers are continuing to protect the key $1.40 support level, and the recent formation of higher lows hints at increased confidence in the market moving forward.

If XRP price can break through its immediate resistance, which lies between $1.45 and $1.50, it may gather more bullish momentum in the sessions ahead.

Compared to the months prior to now, the amount of bearish volatility visible on the chart is lower as well, indicating that sellers may be running out of steam. This has added speculation that XRP may be set up for another breakout rally, especially if the overall crypto market maintains a positive outlook.

XRP price analysis
Source: TradingView

Also Read: XRP ETF Signals Strong Accumulation As Volume Hits $12 Million

XRP Price Buzz Increases After Viral X Post

Discussions surrounding XRP have heated up recently due to a viral post by JacktheRippler X regarding Donald Trump’s recent trip to China and how that relates to the increasing momentum of the CLARITY Act.

The post indicated that cryptocurrency regulatory clarity could provide a significant impetus for XRP and the broader crypto market.

The discussion encouraged XRP supporters and others intrigued by the concept of clearer cryptocurrency regulations in the US, potentially benefiting Ripple-related assets over a longer time horizon.

🚨THE CHINESE PRESIDENT Xi CONFIRMS THE NEW ERA!

NO ONE IS TALKING ABOUT THIS:

🇺🇸 President Trump lands in 🇨🇳 China as the CLARITY ACT heads for a Senate vote. This isn’t coincidence. This is a week for the history books! pic.twitter.com/pCwHmLkubG

— JackTheRippler ©️ (@RippleXrpie) May 14, 2026

In general, the present setup of XRP shows that improvements to technical momentum, along with increasing market optimism associated with regulatory narratives, are on the rise.

Although there is ongoing interest in the $1.50 level as being an important psychological barrier, if there is continued buying pressure, then XRP will likely be able to challenge higher levels of resistance at some point during May.

However, due to the extreme volatility in the cryptocurrency markets, it is possible for prices to change rapidly based on overall market sentiment and macroeconomic events that impact those same prices.

This article contains market analysis and price predictions. These are not guarantees. Crypto markets are volatile. Always DYOR. Not financial advice.

Also Read: XRP Ledger Wallets Holding 10,000 Tokens Hit Record 332,230 High

Filed Under: Ripple (XRP), Cryptocurrency News

ONDO Price Breaks Out of Consolidation as Bullish Momentum Targets $0.69

By Usman Zafar | Edited By Ammar Raza,May 14, 2026, 11:59 PM

Ondo Finance (ONDO) has broken out of a long consolidation phase and is now stabilizing above a new support zone after a strong upward move.

Technical indicators confirm a bullish structure with the ONDO price holding above key moving averages. However, derivatives data suggest stronger positioning alongside cautious trading activity. According to CoinMarketCap, ONDO is trading at $0.4079 with a 24-hour gain of 5.2%.

ONDO price chart

Source: CoinMarketCap

Rising Open Interest Reveals an Improving Outlook

According to Coinglass, the ONDO open interest increased by 2.64%, reaching $191.91 million indicating stronger positioning in the derivatives market. This rise suggests traders are adding or maintaining contracts reflecting growing engagement, potential trend continuation, and improved confidence in market direction.

Rising Open Interest Reveals an Improving Outlook

Source: Coinglass

However, trading volume decreased by 26.25%, falling to $307.59 million, suggesting reduced market activity and participation. This decline may indicate lower volatility or cautious sentiment among traders, reflecting a temporary slowdown in trading momentum.

Also Read: ONDO Price Prediction: Bullish Breakout Signals Massive Rally Toward $1.08

ONDO Price Accumulation Points a Rally Toward $0.69

Furthermore, the crypto analyst Don revealed that the ONDO price seems to be making its local base after several weeks of building up. 

There has been no breakout as the ONDO price movements have remained strong without any major breakdown, suggesting that sellers may have been contained. A round base formation is evident, and this is considered an early indicator of a bullish reversal in sentiment.

ONDO price analysis

Source: Don’s X Post

The traders expect that the formation will develop into a cup and handle formation in case there is a smooth consolidation process with low volatility. 

The momentum remains neutral without any indication of weakness. Traders are monitoring a possible upside target for the ONDO price at $0.69, but they are still waiting for confirmation.

Technical Indicators Point to Strong Upward Momentum

According to TradingView, the ONDO price has been showing great strength following its breakout from the extended consolidation. 

The asset had traded sideways in the range of $0.23 to $0.27 for a number of months before making an explosive move upwards and crossing the 200-day EMA line in May. It had reached levels of nearly $0.48 before reversing. Now, a test of $0.40 has established it as the next support zone.

ONDO Technical Indicators Point to Strong Upward Momentum

Source: TradingView

Technical signs suggest there is a change in momentum. The RSI shot above 80, which represents an overbought condition, and fell back to 67.20. 

However, this comes along with exponential moving averages that start spreading out, indicating an upward direction. This happens when the ONDO price remains above the blue 200-day EMA level of $0.40349.

This article contains market analysis and price predictions. These are not guarantees. Crypto markets are volatile. Always DYOR. Not financial advice.

Also Read: Ondo Finance Integrates Tokenized Stocks into Hyperliquid DeFi

Filed Under: Cryptocurrency News

Will Bitcoin Price Hold $79K or Face a Deeper Correction?

By Arslan Tabish | Edited By Ammar Raza,May 14, 2026, 11:36 PM

Bitcoin price is testing a key support zone as analysts watch whether buyers can defend the current short-term structure, on Thursday, May 14. Market data shows BTC remains positive on the daily and weekly charts, while trading activity has increased across the market.

At the time of writing, Bitcoin (BTC) is trading at $80,872.06, marking a 1.69% rise in the past 24 hours. As per CoinMarketCap data, the trading volume stands at $37.49 billion, up 19.34%, while the crypto king has gained 0.78% over the last seven days.

Source: CoinMarketCap

Also Read: Bitcoin Price Outlook: $76,527 Becomes Crucial Level for Next Market Move

Bitcoin Price Tests Key Trendline

Crypto analyst Ali Martinez highlighted that BTC could be ready for a bounce. He noted that since April 9th, Bitcoin’s price performance has been led by an ascending channel, and BTC has been making repeated attempts to test the higher resistance level.

Martinez cited two recent examples from the same pattern. Bitcoin has rallied back from the $71,000 price level and continues to climb 11% to the channel top around $78,000 on April 13.

He also referenced the move on April 30. Bitcoin was trading flat at $75,000 before rising 10.52% to a high of $82,900.

Source: X

The analyst said Bitcoin is now testing the same rising support trend line at about $79,000. A continuation of this price level could lead to BTC consolidating to the upper channel area around $86,000.

Analysts cautioned that if they did not defend $79,000, the current situation could be compromised. He said it will signify a one-month trend reversal and potential retesting of support levels.

Bitcoin Price Faces Pressure After Trendline Break

Additionally, another analyst, Cryptorphic, mentioned that the Bitcoin price is sitting at an important support zone after losing a short-term rising trendline.

He noted that BTC is attempting to stabilize in the $79,400s, but the overall structure began to show weak signs. He added that Bitcoin is still struggling to reclaim higher levels after the recent move below support.

The analyst noted that the quick recovery after the drop may have created a possible fake breakdown. However, he added that buyers would need to demonstrate strength as Bitcoin continues to trade below the broken trendline.

Source: X

The analyst added that $79,400 is the main level to watch in the near term. He said that if BTC begins closing below that level, then it could have a deeper correction to follow after the immense rally.

Bitcoin’s price prediction has now been left on the $79,000-$79,400 support. A hold may be able to lead to another rebound, but a clear break might signal short-term sellers’ momentum.

This article contains market analysis and price predictions. These are not guarantees. Crypto markets are volatile. Always DYOR. Not financial advice.

Also Read: Binance Coin Price Prediction: BNB Eyes Explosive 61% Surge in 2026

Filed Under: Cryptocurrency News, Bitcoin (BTC)

  • « Go to Previous Page
  • Page 1
  • Interim pages omitted …
  • Page 71
  • Page 72
  • Page 73
  • Page 74
  • Page 75
  • Interim pages omitted …
  • Page 3666
  • Go to Next Page »

Primary Sidebar

Recent Posts

  • ALGO Price Forecast: Can it Break Above $0.1319 Resistance? June 6, 2026
  • XRP Price Struggles at $1 Support While Bullish Cycle Targets Stay Locked at $5, $10 June 6, 2026
  • Galaxy Research Warns CLARITY Act Could Face Major Delays in 2026 June 6, 2026
  • Binance Coin Price Holds $570 as Resistance Triggers Market Uncertainty June 6, 2026
  • Professional Bitcoin Holdings Fall 17% as Hedge Funds Exit Positions June 6, 2026

Footer

News

  • Latest News
  • Altcoin News
  • Bitcoin (BTC)
  • Blockchain
  • Tron (TRX)
  • World

Digest

  • Meet the Founder
  • Price Winning Article
  • DeFi
  • Cyber Security
  • Crypto Scam

Industry

  • Project Review
  • Technology
  • Fintech
  • Tron Exchange
  • New in Town

Tron Universe

  • Event and Tron Parties
  • New in Town
  • Tron Tokens

FOLLOW US

  • Facebook
  • Telegram
  • Twitter
  • Linkedin

Subscribe US

Editorial Policy | Privacy Policy | Disclaimer | Terms and Conditions | Masthead

Copyright © 2026 · Tron Weekly. All Rights Reserved. NOTE: Tron Weekly is an independent crypto news site that adheres to the strict journalism policy anchored on transparency, trust, and objectivity, we have no affiliation with the TRON Foundation, its founder Justin Sun or any other cryptocurrency firm.