• Skip to primary navigation
  • Skip to main content
  • Skip to primary sidebar
  • Skip to footer
  • About TronWeekly
  • Write for us
  • Terms and Conditions
  • Privacy Policy
  • Disclaimer
  • Contact
  • All Posts
  • Advertise

TronWeekly

Crypto World News

  • Home
  • Latest News
  • Opinion
    • Education
    • Best TRON Wallets
    • Beginner’s guide to TRON
    • Tron Tokens
    • Market Analysis
  • Industry
    • Tron Exchange
    • Project Review
  • Press Release
  • Bitcoin (BTC)
  • Ripple (XRP)
  • Advertise
  • About TronWeekly
    • The Team
    • Editorial Policy
    • Write for us
    • Privacy Policy
    • Disclaimer
    • Terms and Conditions
    • Contact
You are here: Home / All Posts

All Posts

Bitcoin Price Holds $80,000 Support as Bulls Eye $100,000 Breakout Target 

By Zagham Abbas | Edited By Ammar Raza,May 9, 2026, 9:39 AM

Bitcoin price is range-bound around a key support zone, amid optimism prevailing in the crypto market. The consolidation phase highlights buying interest at important levels, despite the weakening momentum because of prior gains. 

At the time of writing, BTC is trading at $80,237, with a 24-hour trading volume of $38.25 billion and a market capitalization of $1.61 trillion. Over the last 24 hours, BTC has recorded a modest 0.31% increase, reinforcing a steady Bitcoin price trend rather than sharp volatility or aggressive price swings. 

Bitcoin price chart

Source: CoinMarketCap 

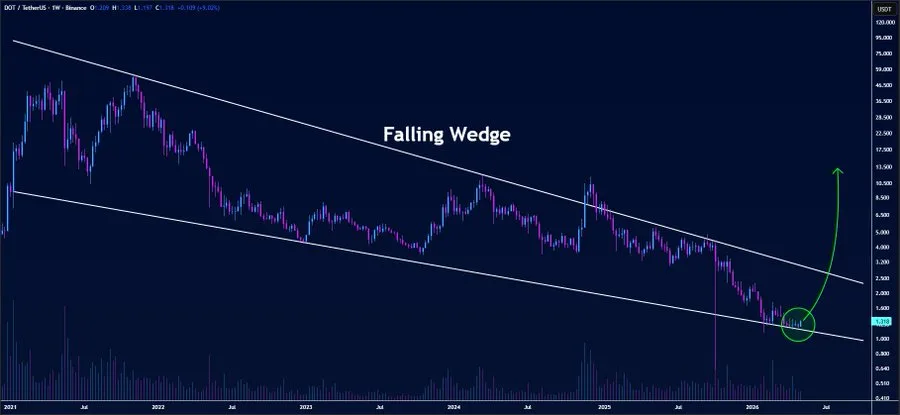
Also Read | JASMY Price Eyes Breakout: Falling Wedge Could Trigger $0.02 Rally 

BTC Price Targets Massive Growth 

On May 8, 2026, crypto analyst Ted presented his audacious projections, reigniting people’s interest in the BTC Price trend. According to his analysis, the Bitcoin price may hit $227,000 when it exceeds Silver’s price, $262,000 when it beats Nvidia’s price, and up to $1,600,000 when it exceeds Gold’s price. 

Bitcoin price analysis

Source: Ted’s X Post 

These highly ambitious objectives have led to heightened discussions around the world regarding the future path that the BTC Price is expected to take. 

BTC Technical Analysis and Market Structure 

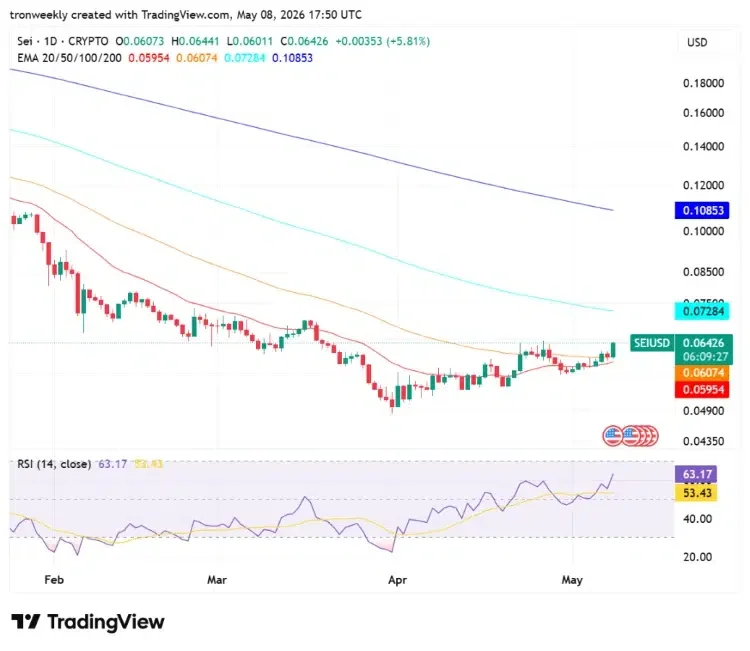
In technical terms, the BTC price is fundamentally strong. RSI is at 62.32 with an MA of 61.72, depicting steady buying momentum without being in overbought territory. RSI holding above 50 indicates that the overall framework of Bitcoin price is bullish. 
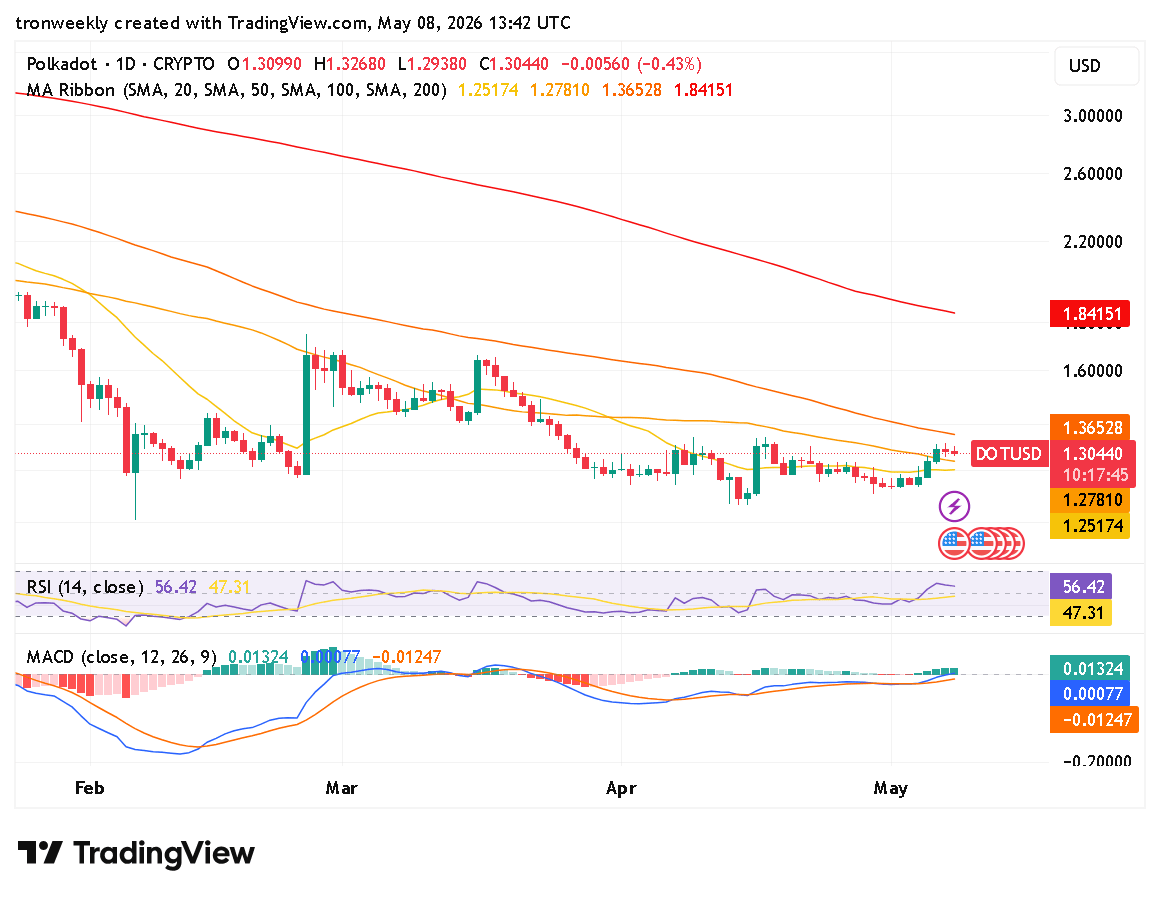
Bitcoin price analysis

Source: TradingView 

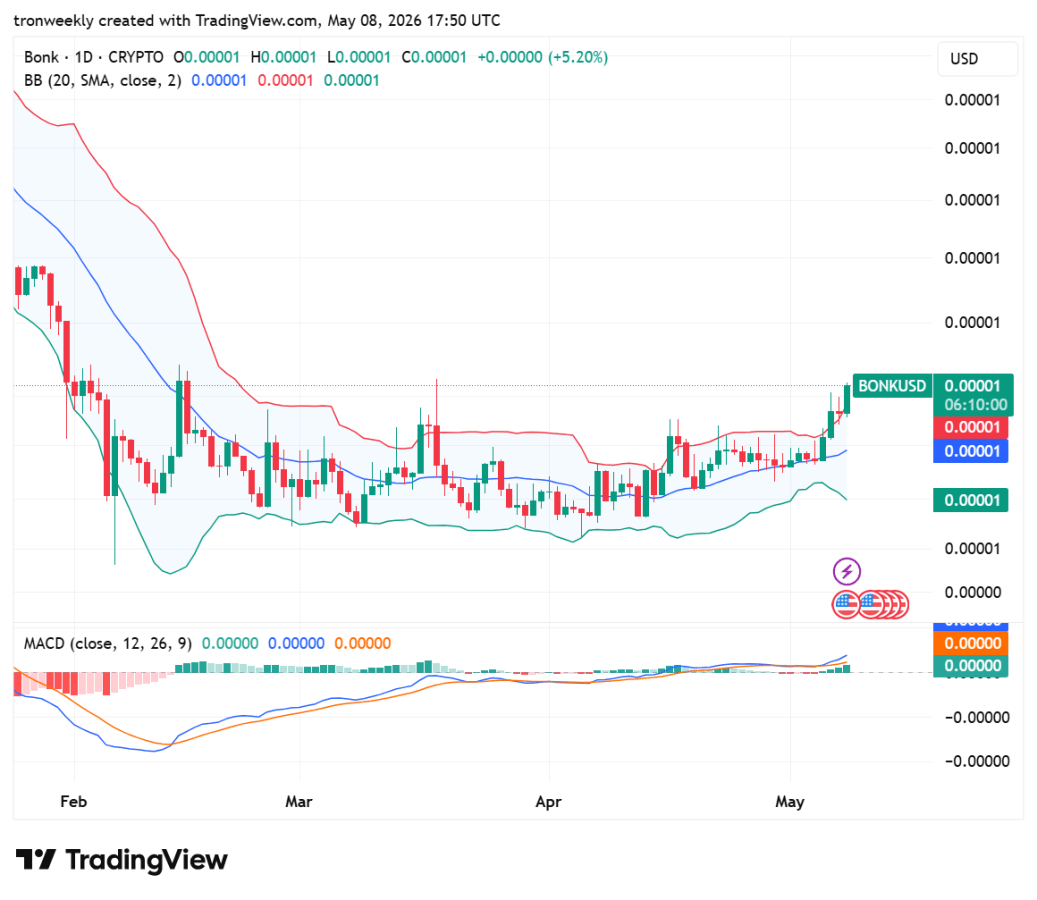
MACD is another technical indicator that supports the forecast of a positive move in the price of Bitcoin. Currently, MACD stands at 1,869.20, which is greater than the signal line of 1,801.36. However, from the falling histogram, there is evidence of slowing growth. 

Nonetheless, the price of BTC continues to be above a significant support level. The 20-day simple moving average of $77,995 is an excellent support level to cushion the trend. 

Bitcoin Price Strong Consolidation Phase 

Overall, the BTC price is in the process of good consolidation at relatively high prices. Although the dynamics have cooled down a little bit, overall the picture is quite stable, and in upcoming trading sessions, it will become clear what the future holds for the Bitcoin price. 

This article contains market analysis and price predictions. These are not guarantees. Crypto markets are volatile. Always DYOR. Not financial advice.

Also Read | Chiliz Price Prediction: CHZ Signals Possible 2,700% Rally 

Filed Under: Cryptocurrency News

Zcash Boosts Bitcoin Privacy with 2026 Quantum Upgrade

By Ananthyka J | Edited By Ammar Raza,May 9, 2026, 8:37 AM

Delphi Digital’s recent publication about Zcash describes the protocol as a privacy and quantum-resistant extension to Bitcoin, a digital currency that is becoming more and more absorbed by traditional finance and is inherently lacking in privacy.

They point to increasing usage of Zcash’s shielded transactions and a technical plan for making the network resistant to quantum weapon attacks in the future.

Increasing Use of Sheilded Pool

One of the reasons Delta Digital explain this change in preference for privacy is Zcash’s shielded pool market cap that has gone up Quite a bit from about 11% in the beginning of 2025 to around 30%, indicating the users’ growing interest in on-chain privacy.

Zcash privacy shield
Source: swissOne Capital |

Their working hypothesis is that the users are not only getting aware of shielded transactions but also actively performing the inter-shielded transactions, thereby making all the integration of digital assets into traditional finance irrelevant.

The transformation is a demonstration of the increased emphasis on privacy amidst the growing regulatory and institutional scrutiny of the blockchain’s transparency.

Also Read: ZEC Price Surges as Bullish Momentum Targets the $600 Resistance Level

Quantum-proof Roadmap and Tachyon Upgrade

ZEC is planning to implement a multi-phase quantum resistant roadmap. The protocol aims to implement protocol-level post-quantum privacy through the Tachyon upgrade that is planned for late 2026.

The future plans also involve the incorporation of quantum-recoverable wallets that will enable users to preserve access to their funds even in post-quantum scenarios. The main long-term focus will be on post-quantum soundness, which is the cryptographic security against future quantum computing advancements.

Quantum-recoverable wallets are coming to Zcash.

We first discussed Zcash’s quantum resistance roadmap in February, highlighting why it matters as Bitcoin’s private, sovereign complement.

First 100 readers can read the report for free.https://t.co/3RoBJHZ9UM https://t.co/wx7w21HPPM pic.twitter.com/7DhfZWIVuq

— Delphi Digital (@Delphi_Digital) May 8, 2026

Also Read: Zcash Price Outlook: ZEC Price Breakout Could Ignite Bullish Rally Above $740

Balancing Privacy, Security, and Compliance

The report sees Zcash as solving the two main problems that need to be addressed. On one hand, the growth in shielded adoption points to ZEC’s market validation, while on the other hand, issues like wallet integration, user experience, and regulatory perceptions of privacy coins continue to exist.

Getting to the bottom of the quantum-resistant roadmap may position Zcash as a forerunner in a space where both the requirements of finance through institutions and security are changing.

Also Read: ZEC Rising Open Interest Signals Potential Rally Toward $600

Filed Under: Cryptocurrency News, Bitcoin (BTC)

Solana Price Holds Key Support as Market Shows Mixed Signals

By Zagham Abbas | Edited By Messam Raza,May 9, 2026, 6:30 AM

Solana price is oscillating around a critical support area amid a bearish and conservative trading environment. The price is stable, but derivative activities are diminishing, indicating indecision among market investors. The primary concern is whether SOL will be able to sustain its support region or decline in price due to increasing selling pressure.

At the time of writing, SOL is trading at $88.86, reflecting a 0.69% gain in the last 24 hours. SOL also records a $4.77 billion daily trading volume and a total market valuation of $51.21 billion, showing stable but cautious movement across the market.

 SOL price chart

Source: CoinMarketCap

Also Read | Solv Protocol Migrates $700M BTC Assets to Chainlink CCIP

Solana Price Support Zone Under Close Watch

As reported by crypto analyst More Crypto Online, Solana Price continues to trade within the identified micro support zone ranging from $86.72 to $88.60. The analysis further states that as long as Solana Price continues to hold above $86.73, the entire structure holds its ground. Failure to stay above this range may lead to a weaker pattern.

Source: More Crypto Online’s X Post

It is at this level that a decision will be made regarding Solana Price recovery from the recent decline, since it could mean either the continuation of its current recovery trend or going into further correction. The buyers’ activities at this level prevent further volatility.

Derivatives Data Signals Weak Participation

In addition to this slow movement witnessed in spot markets, it is evident from derivatives information that there has been less activity as well. The open interest declined by 0.45%, whereas the trading volume was also down to 14.93% at $5.53 and $9.41 billion, respectively.

SOL open interest and volume chart

Source: Coinglass

Funding Rate Points to Bearish Positioning

Sentiment within the derivatives market is cautiously positive, with the OI weighted funding rate holding below zero at -0.0057%. This reflects a continued preference for short positions, implying ongoing short-term downside risks for Solana Price.

Source: Coinglass

However, even with the bearish sentiment, the fact that Solana Price is able to stay above major support indicates that there is still some bullish support in the market. The combination of selling and support may eventually result in a clear resolution as volatility rises.

This article contains market analysis and price predictions. These are not guarantees. Crypto markets are volatile. Always DYOR. Not financial advice.

Also Read | Optimism (OP) Price Outlook: Inverse H-&-S Pattern Targets a Rally to $0.21

Filed Under: Cryptocurrency News

CRV Price Compression Hints at a Breakout With a $0.265 Rally in Focus

By Sadia Ali | Edited By Messam Raza,May 9, 2026, 5:30 AM

Curve DAO Token (CRV) is moving in an upward direction as the general trend in the crypto market has turned bullish. Furthermore, the derivative data also support the CRV price outlook with the rising open interest. According to CoinMarketCap, CRV is currently trading at $0.2568, with the gain of 6.69% over the last 24 hours.

Source: CoinMarketCap

CRV Rising Open Interest Point to Increasing Strength

According to Coinglass, the CRV open interest increased by 9.90%, reaching $112.38 million, indicating stronger market participation and growing trader commitment, with more positions held open across the period, suggesting heightened speculative and hedging activity within the derivatives market.

Source: Coinglass

However, the volume decreased by 18.57%, totaling $114.59 million, reflecting reduced trading activity and weaker short-term market participation, suggesting lower liquidity and diminished transaction flow within the derivatives market.

Also Read: Curve DAO Token Analysis: Can CRV Reach $0.55 Amid Market Consolidation?

CRV Price Compression Hints at Strong Upside Move

Furthermore, the crypto analyst Sjuul revealed that the CRV price is gaining momentum after forming a technical setup that traders have recently associated with strong breakout rallies across the crypto market. 

Following an extended period of compression and sideways consolidation, the CRV price pushed above a key resistance level, signaling growing bullish pressure and the possibility of a volatility-driven expansion phase ahead.

CRV Price Compression Hints at Strong Upside Move

Source: Sjuul’s X Post

The flipped breakout range is considered by market experts to be the crucial pivot point for the continuation of the trend. 

If the buyers sustain their position within this new support range, there are high hopes that the CRV price will find momentum in breaking through the $0.265 resistance point.

CRV Momentum Indicators Reveals a Bullish Outlook

According to TradingView, the CRV price has recovered from the lowest point of 0.20500 in April to trade close to 0.25590, marking an increase of roughly 6.27%. 

The recovery is testing the level of resistance observed in February and March, indicating that there may be a change in the underlying market trend.

CRV Momentum Indicators Reveals a Bullish Outlook

Source: TradingView

Supporting the momentum, the technical indicators lean bullish. The RSI spikes up to 64.27, suggesting increased buying pressure, but is not overbought yet. 

Moreover, there is a positive cross on the MACD indicator, as shown by the expansion in the histogram on the green side. These two factors show that the ongoing bullish trend is highly momentum-driven.

This article contains market analysis and price predictions. These are not guarantees. Crypto markets are volatile. Always DYOR. Not financial advice.

Also Read: CRV Holds Key Support After Drop as Bulls Watch $0.55 Resistance

Filed Under: Cryptocurrency News, Altcoin News

SEI Price Prediction: Breakout Formation Targets $0.76 as Bulls Regain Control

By Sadia Ali | Edited By Jijo SEO,May 9, 2026, 4:30 AM

Sei (SEI) is moving in an upward price trajectory as BTC has started upward movement after the recent cooling-off period. Furthermore, the derivative data also supports SEI price breakout with rising open interest and volume. According to CoinMarketCap, POL is currently trading at $0.06482, with the gain of 6.39% over the last 24 hours.

Source: CoinMarketCap

According to Coinglass, SEI open interest rose by 24.24%, climbing to $77.24 million, indicating increased positioning in the market. This suggests growing trader commitment and potential continuation of current trends with stronger engagement in derivatives activity.

Source: Coinglass

However, the trading volume increased by 4.47%, reaching a total of $101.67 million. This reflects stronger market activity and participation, suggesting improved liquidity and heightened interest among traders in recent sessions.

Also Read: SEI Descending Channel Breakout Hints at Major Upside Move Toward $0.19

SEI Price Breakout Signals Major Bullish Reversal

Furthermore, the crypto analyst Atakan Altun Öz pointed out that SEI is on the verge of halting its prolonged downtrend, as the token moves towards a breakout area within a falling wedge pattern. 

Experts believe that $0.0420-$0.0500 is the critical bullish defense line that should not be breached at any cost. Holding the token above this level may indicate renewed buying interest and pave the way for a strong rebound.

Source: Atakan Altun Öz’s X Post

According to technical expectations, a breakout may take the SEI price to the first objective level of $0.358. The bigger picture suggests that SEI may move up to the price level of $0.762. 

Growing trading volume at the low price supports a positive outlook on further growth momentum development.

SEI Price Outlook Turns Bullish as RSI Climbs to 63

According to TradingView, the SEI price has gradually moved down from February through early April, dropping its price from $0.12000 to about $0.04900, and is still below the important EMAs. 

The recent trend has been flat, and even the SEI price has reclaimed the levels of 20-day EMA and 50-day EMA, which are just around $0.06000.

Source: TradingView

The momentum is gradually tilting towards bullish as the RSI moves up towards 63.17, indicating increasing buying strength. 

However, the token has a massive ceiling ahead. In order for the trend reversal to be fully validated, the SEI price will need to break above the 100-day EMA of $0.07284 and the 200-day EMA of $0.10853.

This article contains market analysis and price predictions. These are not guarantees. Crypto markets are volatile. Always DYOR. Not financial advice.

Also Read: SEI Descending Wedge Signals Potential Reversal Toward $0.50 Target

Filed Under: Cryptocurrency News, Altcoin News

BONK Price Analysis: Bullish Breakout Targets Higher Resistance at $0.94

By Sadia Ali | Edited By Messam Raza,May 9, 2026, 4:00 AM

Bonk (BONK) is moving in a positive price trajectory following the changing conditions in the crypto market. However, the BONK price breakout is also supported by rising open interest. According to CoinMarketCap, the LINK is currently trading at $0.000007140, with the gain of 5.42% over the last 24 hours.

Source: CoinMarketCap

Derivative Data Point to Improving Strength

According to Coinglass, the BONK open interest increased by 3.32%, reaching $9.20 million, indicating fresh market participation and rising positions. This growth suggests traders are adding exposure, reflecting improving sentiment and potential continuation of momentum in the derivatives market.

BONK Derivative Data Point to Improving Strength

Source: Coinglass

However, volume remained stable at $18.40 million, showing consistent trading activity and balanced market conditions. This stability reflects steady investor participation without major spikes, suggesting equilibrium between buying and selling pressure.

Also Read: BONK Could Surge to $0.00001050 After the Rounded Bottom Formation

BONK Price Surge Signals a Rally Toward 0.94

Furthermore, the crypto analyst Chiefrat highlighted that the BONK price is showing renewed bullish momentum as the meme-inspired cryptocurrency continues forming higher lows, a technical pattern often linked with growing buyer confidence. 

The BONK price is now approaching a major resistance zone between 0.733 and 0.740, where traders expect increased volatility. Market analysts believe sustained momentum could trigger BONK’s next significant upward breakout move soon.

Source: Chiefrat’s X Post

The breaking out of the resistance at 0.740 would set the stage for upward price moves towards higher supply regions, located at 0.88 and 0.94. 

Traders have highlighted the need for a significant volume as an important factor that will confirm the breakout and drive the momentum behind it. In case the buyers remain dominant, the BONK price can post further gains.

Technical Indicators Point to a Bullish Reversal

According to TradingView, the BONK price has experienced a long period of stagnation from March to April, following a sharp fall during the month of February. 

During this period, the BONK price trended sideways, indicating that the market was indecisive, with Bollinger Bands contracting and a decrease in volatility. It held on to its position close to the 20-day SMA.

BONK Technical Indicators Point to a Bullish Reversal

Source: TradingView

In May, an optimistic wave emerged with the appearance of the green candles, pushing the price higher towards the top Bollinger Band. 

This trend is confirmed by the presence of a bullish MACD cross and rising green histogram bars, indicating increased buyer pressure. Currently, an increase of 5.20% in the BONK price suggests the likelihood of breaking out of the old horizontal channel.

This article contains market analysis and price predictions. These are not guarantees. Crypto markets are volatile. Always DYOR. Not financial advice.

Also Read: BONK Falling Wedge Breakout Could Trigger Rally Towards 0.0000260

Filed Under: Cryptocurrency News, Altcoin News

BNB Price Breakout Targets $670 Amid $3.5B Treasury Growth

By Athulyamol VS | Edited By Messam Raza,May 9, 2026, 3:30 AM

BNB price sentiment has been bolstered by increased tokenized treasury activity on BNB Chain, as well as a technical breakout above major resistance levels.

In addition to supporting renewed upward momentum, ecosystem expansion and improvements in technical indicators are attracting market participants’ attention to BNB. At press time, the coin is trading at around $648.55 with an increase of nearly 1.81% over the past 24 hours.

BNB Price Breakout Signals Strength

BNB’s daily TradingView chart indicates that the asset has broken through the $645.81 resistance zone after opening at $637.02 and registering an intraday high of $649.50.4

The formation of a bullish candle along with the closing price being above the resistance shows that buyers were active during the session, and the close above the resistance level is a positive sign for the short-term market structure.

There was a volume of 90.41K BNB; this shows that there is solid participation behind this upward price movement and that this movement is not a weak breakout attempt. Current technical indicators are also supportive of the present trend.

The MACD line continues to stay above the signal line despite weakening momentum.

Although the positive histogram value of 1.77 indicates a slowing down of upward strength, it still shows that there is continued upward momentum despite the slowing strength. The support level of $618.54 remains an important zone of downside support.

If buyers can maintain above the breakout area, traders will begin to watch for the next resistance area in the $660 – $670 range.

BNB price analysis
Source: TradingView

Also Read: BNB Price Analysis: Can Bulls Push Toward the $650 Target?

BNB Price Gains Support From Treasury Growth Narrative

According to a recent tweet from BNB Chain referencing information from Token Terminal, the market capitalization of all treasury assets (i.e., digital assets that have been tokenized) on BNB Chain has now reached approximately $3,500,000,000.

Some of the other specific assets mentioned in this tweet included “USYC,” “BUIDL,” “iBENJI,” and “vBILL” – just to name a few.

The increase in activity surrounding tokenized treasury assets in conjunction with the simultaneous growth of participation in BNB Chain by institutional participants appears to be helping strengthen the broader ecosystem of BNB Chain, as the BNB price is currently stabilizing above significant resistance levels.

Money moves on BNB Chain https://t.co/LCGf74pCsx

— BNB Chain (@BNBCHAIN) May 8, 2026

BNB price is currently demonstrating a strong technical trend, while the fundamentals behind the BNB Chain ecosystem continue to strengthen.

There may still be some uncertainty among traders as they look to see if the volume and momentum necessary to support a breakout to the upside from the previous resistance levels can be maintained, but the market as a whole is still extremely volatile.

This article contains market analysis and price predictions. These are not guarantees. Crypto markets are volatile. Always DYOR. Not financial advice.

Also Read: BNB Price Analysis: Can Bulls Push Toward the $650 Target?

Filed Under: Cryptocurrency News, Altcoin News, Binance Coin (BNB)

Ethereum Price Analysis: Can ETH Reclaim $2,400 After Recent Decline?

By Sajjal Ali | Edited By Messam Raza,May 9, 2026, 3:00 AM

Ethereum (ETH) is moving in a consolidation phase due to BTC’s downward movement after facing the resistance above $82K. However, the institutional demand for ETH is increasing as the whales are constantly buying ETH, reflecting confidence in the Ethereum price outlook. According to CoinMarketCap, ETH is currently trading at $2,292.83, with a 24-hour loss of 1.56%. 

ETH current price

Source: CoinMarketCap

Ethereum Price Faces Threat Amid Negative ETF Flows

Furthermore, the crypto analyst Ted revealed that the Ethereum price has slipped below the crucial $2,300 level, increasing bearish pressure across the crypto market. Investor sentiment weakened after Ethereum ETF flows turned negative, signaling slowing institutional demand. 

Meanwhile, on-chain data indicates that major whale wallets have started selling significant ETH holdings, raising concerns about further downside momentum in the near term.

Ethereum price prediction

Source: Ted’s X Post

Market analysts believe Ethereum must reclaim and hold above the $2,400 resistance level to restore bullish momentum. Strong spot demand will be essential for any sustainable recovery, as current market conditions remain fragile. 

Without renewed buying pressure and improved investor confidence, ETH could continue facing volatility and additional correction risks ahead.

Also Read: Ethereum Price Holds Key Support as Tokenized Treasuries on Network Cross $8 Billion

Technical Indicators Point to a Consolidation Phase

According to TradingView, the Ethereum price is currently hovering near $2,289, consolidating after a sharp decline from its $4,800 peak. 

Price action sits precariously between the blue Kijun-sen and the 20-week SMA at $2,361. The market lacks clear momentum as it attempts to stabilize above the $2,197 support level, signaling a cautious pause within a broader corrective phase.

ETH technical analysis

Source: TradingView

Macro indicators signal a sideways market environment. The Ichimoku cloud is becoming narrower, whereas the upper Bollinger band around the $3,350 mark represents a strong barrier. 

In order for there to be an uptrend, the Ethereum price will have to move back above $2,700. As far as the lower bound is concerned, the Bollinger band at $1,498 represents the critical support line.

Ethereum Whale Activity Sparks Bullish Speculation

Apart from the price movements, the mysterious whale associated with Erik Voorhees has doubled down on its bet in the Ethereum market, investing 6.67 million USDT for 2,920 ETH, costing them around $2,284 each, as per the data from Lookonchain. 

Previously, the same wallet shocked the market when it collected a large quantity of 123,184 ETH worth $266 million, garnering the attention of analysts due to their massive blockchain activities.

Ethereum whale activity

Source: Lookonchain’s X Post

With the most recent wave of accumulation, there have been rumors about major players preparing themselves for the next push by Ethereum based on their regained trust in the industry. 

Although there is not an officially proven connection between the account and Voorhees, market participants believe that the series of purchases is a bullish signal.

This article contains market analysis and price predictions. These are not guarantees. Crypto markets are volatile. Always DYOR. Not financial advice.

Also Read: Ethereum Price Holds Near $2,300 as Market Struggles to Break Resistance

Filed Under: Cryptocurrency News, Ethereum (ETH)

Polkadot Price Eyes Recovery as Bulls Defend Key Support Zone

By Zagham Abbas | Edited By Ammar Raza,May 9, 2026, 2:00 AM

Polkadot price appears to be recovering from its recent downturn, with buyers still holding the price at a significant support zone on the weekly chart. The current positive trend in the technical metrics has raised hopes for the DOT Price, especially as analysts expect more gains if the bullish sentiment becomes stronger.

At the time of writing, DOT is trading at $1.31, down 0.41% over the last 24 hours. Despite the slight decline, daily trading volume remained strong at $209.80 million, while its market capitalization stood at $2.21 billion. The latest DOT Price movement suggests that investors are closely watching whether the asset can maintain support and build momentum for another upward move.

Source: CoinMarketCap

Also Read | Solv Protocol Migrates $700M BTC Assets to Chainlink CCIP

Polkadot Price Holds Key Weekly Support

Interest in the market grew after crypto analyst Butterfly shared, an optimistic view of the weekly chart formation for DOT. Butterfly believes that Polkadot is still trading above the bottom line of the descending wedge pattern, which generally indicates a favorable situation provided that support lines hold.

Polkadot Price Holds Key Weekly Support

Source: Butterfly’s X Post

The analyst noted that bulls are working hard to defend the crucial level amid rising buying interest at present levels.

The recent movements in DOT Price also show that momentum is turning positive. After bouncing back somewhat from the recent lows, DOT will be looking to maintain a position above the short-term moving average ribbon marks of $1.25 and $1.27. Sustaining an above-the-supports position may help give DOT sufficient momentum to stage a recovery.

Technical Indicators Support DOT Price Recovery

The technical indicators are now on the side of the bulls as buying pressure starts to rise. RSI has moved up to 56.42, breaking through the neutral point of 50 and its signal level of 47.31. This suggests that market strength is rising from an earlier weak position.

DOT technical indicator chart

Source: TradingView

In addition to this, the MACD indicator is also showing positive readings. The MACD line has an indicator reading of 0.01324, which is now positioned above the signal line of 0.00077, while the histogram shows positive readings of 0.01247. This implies that bullish strength could continue to develop further.

With the buying force on the rise, there is a belief that the Polkadot Price will head to the next level of resistance, which lies around the 100-day simple moving average at $1.36. A break of this level will be bullish for DOT.

This article contains market analysis and price predictions. These are not guarantees. Crypto markets are volatile. Always DYOR. Not financial advice.

Also Read | Kraken Parent Expands Stablecoin Payments With $600M Reap Deal

Filed Under: Cryptocurrency News, Altcoin News

Switzerland Bitcoin Reserves Bid Fails as Campaign Ends

By Arslan Tabish | Edited By Messam Raza,May 9, 2026, 1:00 AM

Switzerland’s campaign to add Bitcoin reserves to the Swiss National Bank has failed after organizers missed the signature target for a national referendum. The proposal sought to place Bitcoin beside gold and foreign currencies in the central bank’s reserves.

Campaigners had 18 months to collect enough public support. They did not reach the required threshold before the deadline. The result ends the initiative for now under Switzerland’s direct democracy system.

Also Read: Tether Freeze Hits $514M USDT Across Tron and Ethereum in 30 Days

Bitcoin Reserves Debate Widens in Europe

The proposed regulation would have required the Swiss National Bank to keep Bitcoin as one of its reserve currencies. Proponents believed that it would help decrease the dependence on the U.S. dollar and the euro. 

As per the Reuters report, this failed attempt highlights the growing rift across Europe. There is still no consensus among policymakers regarding the inclusion of cryptocurrencies in reserve strategies by central banks. The debate has grown as digital assets become more visible in global finance.

Several institutions have been experimenting with blockchain technology. Others have been worried about their liquidity, safety, and volatility issues.

European Central Bank policymakers said that the assets should be liquid, protected, and safe. Bitcoin’s price weakness has added to those concerns. The cryptocurrency has lost around 7.5% this year, following its decline by 6.4% in 2025.

Campaign founder Yves Bennaim dismissed the criticisms of Bitcoin’s liquidity problems. He cited the billion-dollar transactions that occur daily in international crypto exchanges. Bennaim argued that Bitcoin represents an alternative to the dollar and euro, similar to Switzerland’s neutrality.

Proponents emphasized that the campaign served a broader objective. They wanted Swiss authorities to evaluate technologies that are transforming the finance sector. They might launch another initiative in the future regardless of this failed referendum campaign.

Source: Reuters

Swiss Firms Expand Blockchain Services

However, failure does not signify that the Swiss crypto industry has stopped moving forward. Currently, many financial companies from the country keep increasing their blockchain-based solutions.

For instance, recently, AMINA Bank has become the first FINMA-registered bank to introduce custody and trading services for Canton Coin. 

Through this integration, the bank will provide its institutional customers with the opportunity to trade Canton Coin, which will ensure them access to the Canton Network. It provides tokenization, collateral management, and settlement infrastructure.

AMINA is now the first regulated bank to support custody and trading for Canton Coin. 

For institutional, corporate, and professional investors, digital assets are increasingly about infrastructure, scale, and execution discipline, not experimentation.  @CantonNetwork… pic.twitter.com/04b9Urx1Er

— AMINA Bank (@AMINABankGlobal) May 6, 2026

Several other organizations are backing up the Canton Network. This list includes Goldman Sachs, Visa, Citadel, and Depository Trust & Clearing Corporation.

Besides, Swiss banker Marc Syz has decided to develop the Future Holdings AG company following his departure from Banque Syz SA. As per Bloomberg, Marc is planning to create Europe’s leading Bitcoin treasury company by introducing a dual listing in the future.

The recent failure has prevented the Swiss government from advancing its plan regarding the creation of Bitcoin reserves in the country. However, this does not imply that the Swiss financial sector has stopped experimenting with blockchain and digital tokens.

Also Read: Taiwan Lawmaker Pushes Bitcoin Reserves Plan Using National Foreign Reserves

Filed Under: Cryptocurrency News

  • « Go to Previous Page
  • Page 1
  • Interim pages omitted …
  • Page 89
  • Page 90
  • Page 91
  • Page 92
  • Page 93
  • Interim pages omitted …
  • Page 3666
  • Go to Next Page »

Primary Sidebar

Recent Posts

  • ALGO Price Forecast: Can it Break Above $0.1319 Resistance? June 6, 2026
  • XRP Price Struggles at $1 Support While Bullish Cycle Targets Stay Locked at $5, $10 June 6, 2026
  • Galaxy Research Warns CLARITY Act Could Face Major Delays in 2026 June 6, 2026
  • Binance Coin Price Holds $570 as Resistance Triggers Market Uncertainty June 6, 2026
  • Professional Bitcoin Holdings Fall 17% as Hedge Funds Exit Positions June 6, 2026

Footer

News

  • Latest News
  • Altcoin News
  • Bitcoin (BTC)
  • Blockchain
  • Tron (TRX)
  • World

Digest

  • Meet the Founder
  • Price Winning Article
  • DeFi
  • Cyber Security
  • Crypto Scam

Industry

  • Project Review
  • Technology
  • Fintech
  • Tron Exchange
  • New in Town

Tron Universe

  • Event and Tron Parties
  • New in Town
  • Tron Tokens

FOLLOW US

  • Facebook
  • Telegram
  • Twitter
  • Linkedin

Subscribe US

Editorial Policy | Privacy Policy | Disclaimer | Terms and Conditions | Masthead

Copyright © 2026 · Tron Weekly. All Rights Reserved. NOTE: Tron Weekly is an independent crypto news site that adheres to the strict journalism policy anchored on transparency, trust, and objectivity, we have no affiliation with the TRON Foundation, its founder Justin Sun or any other cryptocurrency firm.