• Skip to primary navigation
  • Skip to main content
  • Skip to primary sidebar
  • Skip to footer
  • About TronWeekly
  • Write for us
  • Terms and Conditions
  • Privacy Policy
  • Disclaimer
  • Contact
  • All Posts
  • Advertise

TronWeekly

Crypto World News

  • Home
  • Latest News
  • Opinion
    • Education
    • Best TRON Wallets
    • Beginner’s guide to TRON
    • Tron Tokens
    • Market Analysis
  • Industry
    • Tron Exchange
    • Project Review
  • Press Release
  • Bitcoin (BTC)
  • Ripple (XRP)
  • Advertise
  • About TronWeekly
    • The Team
    • Editorial Policy
    • Write for us
    • Privacy Policy
    • Disclaimer
    • Terms and Conditions
    • Contact
You are here: Home / All Posts

All Posts

Chainlink Price Prediction: LINK Signals Rally As Breakout Targets $20

By Sajjal Ali | Edited By Ammar Raza,May 9, 2026, 11:00 PM

Chainlink is gaining fresh momentum after breaking above a major resistance area that had restricted price movement for several weeks.

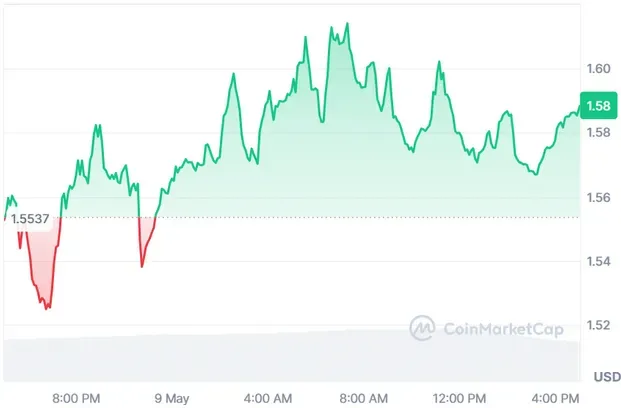
The latest Chainlink price prediction is bullish because LINK is trading above the critical range between $9.60 and $9.75, a level that has been holding back prices amid the current market downturn.

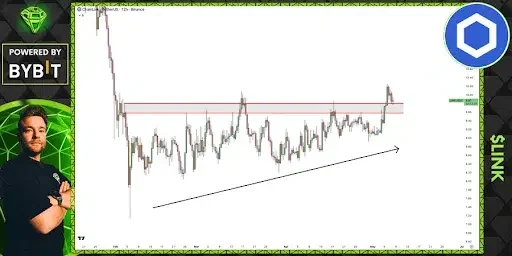
In a Friday post, trader Sjuul commented that LINK managed to break out of its resistance, after which the price had been confined in a narrow range for quite some time.

This year, LINK faced significant sell pressure and moved towards the range of $7.20-$7.40. Afterward, the price began to rise gradually and form higher lows on its chart.

This formation is often indicative of increased buyer confidence because they begin to initiate their position at an early stage.

Source: X

Also Read: XRP Price Eyes Explosive $12 Rally as Historical Support Zone Holds Strong

Chainlink Price Prediction Turns Bullish After Breakout

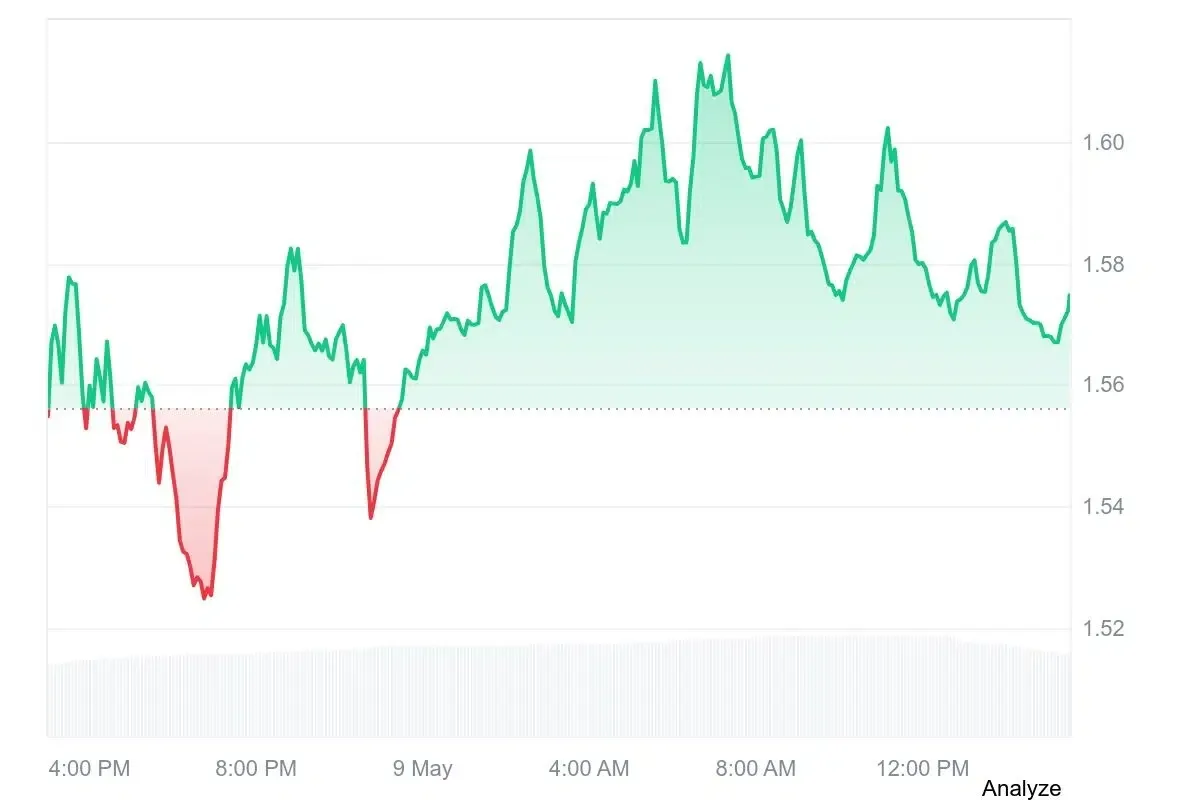
Chainlink’s price prediction for its newest update got confirmed following LINK’s breakout from the ascending triangle. This is formed where bulls continue to drive the price higher, but resistance remains constant.

LINK has been attempting multiple breakouts since March/April before succeeding in breaking out higher towards $10.20.

Traders need to see whether the LINK is able to hold the $9.60-$9.70 level after this breakout. The potential levels that will come next if momentum continues are around $10.50 and $11.00, which might favor the reversal scenario.

The trading volumes have increased, implying higher demand compared to the consolidation phase. Short-term retracements around the resistance are also likely. If LINK breaks below the support, its next range will likely be between $8.80-$9.50.

Daily Chart Signals Larger Recovery Structure

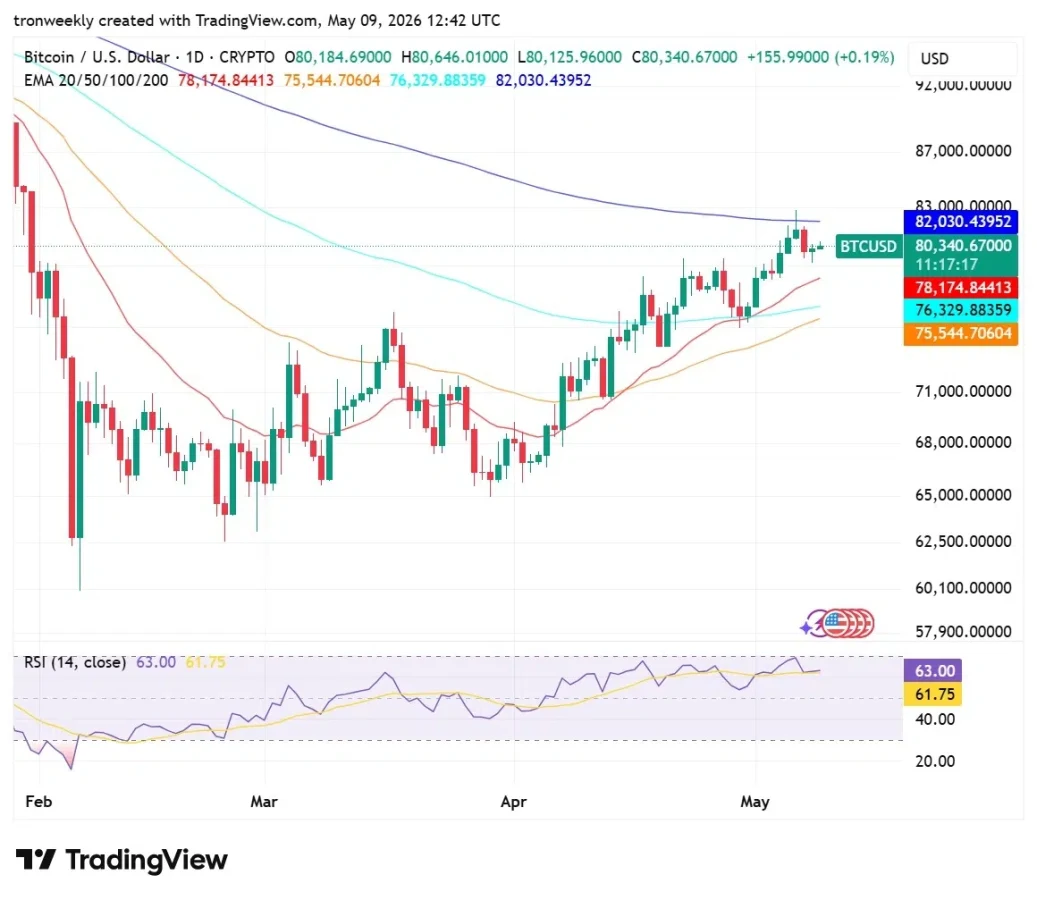
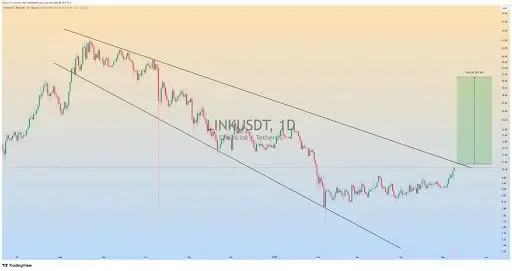
There is also an individual daily timeframe trend analysis, and here, there is yet another bullish factor about Chainlink’s price prediction. It is highlighted that LINK is apparently forming a descending broadening wedge after months of being within a downward trend channel since late 2023.

Breaking out the resistance line of the descending trend channel is considered to be one of the most critical technical developments for LINK recently.

Market participants believe that breaking out the daily price levels between $14.00 and $15.00 could end the negative technical setup prevailing over the last year.

Source: X

As seen in the daily chart below, there was considerable buying activity close to the $11.00-$12.00 level following the fall in February.

This buying activity played a role in stabilizing the market, thus forming the base of the present rally. With reference to the simplest breakout projections, the current Chainlink price prediction points to potential gains of around $20.00-$21.00.

This article contains market analysis and price predictions. These are not guarantees. Crypto markets are volatile. Always DYOR. Not financial advice.

Also Read: AAVE Price Outlook: Support Holds Firm as Bulls Eye $105 Target

Filed Under: Cryptocurrency News

DASH Price Prediction: Breakout Setup Could Trigger Rally Toward $476

By Usman Zafar | Edited By Ammar Raza,May 9, 2026, 10:30 PM

DASH is gaining renewed market attention as its long-term chart structure shows signs of recovery after an extended period of decline. DASH price is stabilizing within a broader accumulation phase, with analysts watching for a breakout above key resistance zones that could support further upward momentum. According to CoinMarketCap, as of Saturday, May 9, DASH is trading at $50.16 with a 24-hour gain of 1.9%.

DASH price chart

Source: CoinMarketCap

Also Read: Dash (DASH) Bullish Breakout Signals Targets $55 Resistance After 28% Rally

DASH Price Could Surge to $476 If Momentum Holds

Furthermore, the crypto analyst Flippix revealed that DASH is beginning to attract attention as its long-term chart structure starts resembling previous deep-value recovery plays seen across older crypto cycles. 

After years of decline, the asset has stopped printing major new lows and is now stabilizing within a broad accumulation range, signaling that prolonged selling pressure may finally be fading from the market.

Analysts are looking at the older resistance levels that had played important roles during the last bullish wave, namely at $137, $286, and $476. 

The DASH price continues trading well below the levels where it used to set highs, and in the environment of low volatility, any small positive move can translate into significant increases.

DASH price analysis

Source: Flippix’s X Post

Technical confirmation of such a move would include a strong bounce back into the region of $130 to $140, which previously provided strong resistance for price growth. 

If the DASH price holds above that region amid an overall crypto uptrend, the chart will very quickly open up towards new weekly resistance levels.

Technical Indicators Support Upward Momentum

According to TradingView, the DASH price on the daily chart shows a significant bullish breakout following a period of consolidation in the range of $30. The DASH price recently went above the 200-day moving average, which currently stands at $46.87. 

The current price is $50.12; however, this is after several instances of rejection seen from the formation of upper long shadows.

DASH price analysis

Source: TradingView

Technical analysis suggests that the move has gone on for too long. The RSI value is now 71.52, indicating that it is in overbought territory, which generally sets the stage for a reversal of direction, or at least a sideways move in the short term. 

While the moving average ribbon does form a bullish fan pattern, it is likely that the price will retest the $47 level.

This article contains market analysis and price predictions. These are not guarantees. Crypto markets are volatile. Always DYOR. Not financial advice.

Also Read: DASH Falling Wedge Signals Potential Bullish Breakout Move Toward $250

Filed Under: Cryptocurrency News, Altcoin News

TeraWulf Reports $427M Q1 Loss as Bitcoin Mining Revenue Falls

By Yahya Raza Sherazi | Edited By Messam Raza,May 9, 2026, 10:28 PM

TeraWulf reported a wider first-quarter loss as weaker Bitcoin mining revenue weighed on results. The company also expanded its artificial intelligence infrastructure business. Its latest figures show a major shift in revenue toward high-performance computing services during the quarter.

According to a report, the Bitcoin miner posted a net loss of $427 million for the first quarter of 2026. That compared with a $61.4 million loss in the same period last year. The increase came as mining revenue declined and sector economics remained under pressure.

Also Read: Pakistan IMF funding boost: IMF releases $1.32 billion under EFF climate programs

TeraWulf AI Leasing Revenue Outpaces Bitcoin Mining

Quarterly revenue reached $34 million. AI and computing leasing generated $21 million of that amount. Bitcoin mining revenue fell by 50% to about $13 million.

TeraWulf said demand for AI computing infrastructure continued to support its business transition. The company is moving further into long-term leasing tied to high-performance computing. This strategy aims to reduce exposure to sharp changes in mining income.

The Chief Executive Officer (CEO), Paul Prager, said that as the year 2026 started, contracts, infrastructure, and financing were in place. He said management is now concentrating on leveraging them to generate recurring revenues. 

The quarterly reports indicated that AI leasing made up a significant percentage of the company’s income.

TeraWulf brought online 60 megawatts (MW) of key IT capacity for Core42 at the Lake Mariner facility. The firm also expanded the facility further alongside its partners Fluidstack and Google. Other facilities such as CB-3, CB-4, and CB-5 will soon begin operations this year.

Source: TeraWulf

TeraWulf Expands Power Capacity for AI Infrastructure

According to CFO Patrick Fleury, long-term leases have helped achieve revenue stability. Recurring artificial intelligence infrastructure revenue may reduce the volatility of earnings connected to Bitcoin mining operations. At the end of the quarter, TeraWulf had about $3.1 billion in cash and restricted cash.

The company is also developing its overall infrastructure capabilities. It operates facilities in Hawesville, New York, and Maryland. The Hawesville facility has access to up to 480 megawatts of power.

According to TeraWulf, it will increase its contracted capacity by 250 to 500 megawatts yearly. This strategy will aid the firm in establishing itself in the computing infrastructure industry. This is also indicative of how the business utilizes its power resources for artificial intelligence workloads.

Other miners have adopted a similar approach. Riot Platforms generated $33.2 million in additional data center revenues for the quarter under review. The company’s growth was mainly attributed to its AMD-associated computing infrastructure expansion.

It represents a broader shift in the mining industry. The businesses are looking for sources of income outside of their block rewards and transaction fees. The company’s performance reflects the growing importance of AI infrastructure in this shift.

Also Read: BlackRock’s 2026 Ethereum Launch Boosts On-Chain Finance

Filed Under: Cryptocurrency News

Celestia Price Outlook: TIA Price Breakout Targets a Potential 300–400% Rally

By Usman Zafar | Edited By Ammar Raza,May 9, 2026, 10:00 PM

Celestia (TIA) price action is compressing under a key resistance level, indicating a potential breakout setup as momentum gradually builds. Improving momentum indicators and expanding volatility suggest a possible bullish reversal if a breakout is confirmed. While derivative data point to a cautious outlook. According to CoinMarketCap, as of Saturday, May 9, the TIA price is standing at $0.4390 with signs of stability over the last 24 hours.

TIA Price chart

Source: CoinMarketCap

TIA Derivative Data Point to Cautious Optimism

According to Coinglass, the TIA open interest fell by 0.38%, settling at $72.35 million, reflecting a slight reduction in outstanding derivative positions, which may indicate modest position closing or decreased market commitment among traders, signaling subdued speculative engagement.

TIA Derivative Data Point to Cautious Optimism

Source: Coinglass

Trading volume decreased by 26.30%, reaching a total of $157.76 million, indicating reduced market activity compared to the previous period, with fewer transactions occurring overall, suggesting lower participation or liquidity in the asset.

Also Read: Celestia (TIA) Breaks Key Resistance as Price Targets a Breakout to $0.70

TIA Price Setup Points to a 300–400% Rally 

Furthermore, the crypto analyst ZAYK charts highlighted that TIA looks poised to make an important technical breakaway from its current range following several weeks of consolidation, where the TIA price has been compressed below a strong resistance level. 

The formation of such a pattern can suggest a buildup of momentum since sellers and buyers have come into balance.

TIA price analysis

Source: ZAYK Charts’ X Post

In the event that the TIA price breakout is successfully confirmed by a high volume, there will be expectations of a bullish move with the target range above $2.50. 

The move may indicate a 300% to 400% increase compared to the current price levels. Confirmation is crucial here, as breakouts can sometimes fail and quickly reverse direction instead of continuing the trend.

TIA Technical Outlook Points to Bullish Reversal

According to CoinMarketCap, there seems to be an observable change in the TIA price, where it has moved from a steady bear trend to a new bull trend phase. 

From falling below $0.60 and establishing itself on solid support at $0.30, the current position has gone up significantly to $0.44061.

TIA price analysis

Source: TradingView

The technical indicators also serve to reinforce the change in sentiment in the market. The MACD shows the formation of a bullish crossover with increasing green histogram bars, indicating that the uptrend is gaining pace. 

At the same time, the expansion of the Bollinger Bands points to the termination of the earlier low volatility environment, indicating the beginning of a new trend for the TIA price.

This article contains market analysis and price predictions. These are not guarantees. Crypto markets are volatile. Always DYOR. Not financial advice.

Also Read: Celestia (TIA) Price Trend Suggests Gradual Reversal Toward $0.40 Breakout

Filed Under: Cryptocurrency News, Altcoin News

SUSHI Price Analysis: Ascending Triangle Pattern Hints at $0.26 Breakout

By Usman Zafar | Edited By Ammar Raza,May 9, 2026, 9:18 PM

SushiSwap (SUSHI) forms an ascending triangle, suggesting a potential breakout, while derivatives show declining open interest and volume, indicating caution, and technical indicators reveal fading bearish momentum for the SUSHI price with an oversold RSI and weakening MACD, signaling possible consolidation. According to CoinMarketCap, as of Saturday, May 9, SUSHI is trading at $0.2423 with a 24-hour loss of 2.28%.

SUSHI price chart

Source: CoinMarketCap

SUSHI Derivatives Point to Decreasing Strength

According to Coinglass, the SUSHI open interest declined by 1.87%, reaching $19.08 million, indicating a slight reduction in outstanding derivative positions, reflecting lower trader commitment and cautious market sentiment, with participants reducing exposure amid uncertain short-term conditions.

Sushi on chain data

Source: Coinglass

Volume decreased by 27.76%, totaling $27.04 million, suggesting reduced trading activity and liquidity, with weaker participation from market participants and a possible shift toward caution or consolidation, reflecting changing sentiment and lower engagement in the broader trading.

Also Read: SUSHI Price Prediction: Consolidation Signals Potential Rally Toward $0.24

Momentum Indicators Point to Oversold Conditions

According to TradingView, the RSI stands at 33.43, which is just above the over-sold zone. This signifies extreme bearish sentiment due to a long-term downward trend. 

Although the signal line is still below at 32.44, its upward trajectory shows that sellers have finally become exhausted and may create a temporary support level.

SUSHI price analysis

Source: TradingView

The MACD stays below zero at -0.12566 but lags behind the signal line. However, the bars of the histogram are getting shorter towards zero, indicating that the bearish trend lacks momentum. 

The fact that the MACD moves closer to the signal line indicates a shift from a downtrend to consolidation.

SUSHI Price Setup Signals Potential Bullish Breakout

Despite this cautious outlook, the crypto analyst Alpha Crypto Signal revealed that the SUSHI technical formation can be described as an ascending triangle. 

It can be seen that the SUSHI price has been consistently moving against a horizontal resistance while forming a sequence of higher lows. The SUSHI price setup shows the trend of accumulation since the buyers keep buying despite the constant pressure of sell-offs.

SUSHI price analysis

Source: Alpha Crypto Signal’s X Post

A clear breakout above the resistance line will provide further evidence that bulls are still in control, leading to an upward move towards the $0.25-$0.26 levels. 

In case of a strong breakout by the SUSHI price, however, the uptrend line will continue to act as a strong level of support, from which bulls can step back in.

This article contains market analysis and price predictions. These are not guarantees. Crypto markets are volatile. Always DYOR. Not financial advice.

Also Read: SushiSwap (SUSHI) Outlook Strengthens: Trendline Break Could Trigger $0.64 Rally

Filed Under: Cryptocurrency News, Altcoin News

Hyperliquid Rally Strengthens: HYPE Price Could Surge Above $43.7 Resistance

By Mishal Ali | Edited By Ammar Raza,May 9, 2026, 7:30 PM

Hyperliquid (HYPE) is moving in an upward consolidation phase as BTC has maintained its position above the $80K level. However, the HYPE price breakout is also supported by rising open interest and volume. According to CoinMarketCap, as of Saturday, May 9, HYPE is currently trading at $43.46, with a 24-hour gain of 2.18%. 

HYPE current price

Source: CoinMarketCap

HYPE Derivative Data Reveals Bullish Potential

According to CoinGlass, the HYPE open interest also recorded positive growth, climbing 3.61% to $1.68 billion. The increase suggests that more positions were opened in the market, signaling rising confidence among participants and the potential continuation of the positive trend.

HYPE open interest and volume

Source: Coinglass

Furthermore, trading volume experienced an increase of 9.37%, reaching $948.12 million. This rise indicates heightened market activity and stronger participation from traders and investors, reflecting growing interest and momentum in the market.

Also Read: Hyperliquid (HYPE) leads perpetual DEX surge, bullish breakout targets $120

HYPE Price Eyes Breakout With $43.70 in Focus

Furthermore, the crypto analyst The Cryptomist pointed out that HYPE continues to gain positive attention from traders, being recognized as one of the best long positions that investors can take. 

The token continues to exceed the traders’ expectations in maintaining higher lows amidst volatile market trends while retaining a strong buy-in trend. The analysts indicate that the current streak is evidence of investor confidence in HYPE.

HYPE price prediction

Source: The Cryptomist’s X Post

The HYPE price chart is under close scrutiny as it starts to form an ascending triangle, a classic breakout pattern. This suggests that bulls have started to nibble through resistance while gaining momentum. 

If confirmed, it is expected that the token will break out into gains in the direction of the $43.7 area, possibly accompanied by increased volume and a new wave of buying.

Technical Indicators Point to Bullish Outlook

According to TradingView, the HYPE price is showing an evident upward trend, currently trading near the $43.38 mark. From February onwards, there have been a series of higher highs and higher lows, consistently holding above the 20-day EMA level. 

This suggests persistent buying pressure and an ascending trend towards an important local resistance area.

HYPE technical analysis

Source: TradingView

The HYPE price remains above all four EMAs, positioned in perfect bullish alignment: the 20, 50, 100, and 200 EMAs. 

At the RSI reading of 59.15, it appears the market could still rise before becoming overbought. This means bulls will be ready for an eventual breakout above 44.00 to help drive the current recovery.

This article contains market analysis and price predictions. These are not guarantees. Crypto markets are volatile. Always DYOR. Not financial advice.

Also Read: Hyperliquid DATs Accumulate Close to 9% of HYPE Supply

Filed Under: Cryptocurrency News, Altcoin News

ADA Price Analysis: Cardano Eyes Breakout as $0.25 Support Holds

By Yahya Raza Sherazi | Edited By Ammar Raza,May 9, 2026, 7:00 PM

ADA price analysis for May 9 shows Cardano’s latest rebound has brought market focus back to a major support zone. Traders are watching whether the token can hold its recovery structure as spot activity, derivatives data, and technical indicators improve.

As of writing, Cardano (ADA) is trading at $0.2730, showing a 3.3% increase in the past day. The trading volume is up by 12.91% and is currently standing at $474.54 million. Over the last week, the coin price has risen by 9.98%, according to CoinMarketCap.

Source: CoinMarketCap

Also Read: Bitcoin Dominance Holds 60% as Market Consolidates Near $1.61 Trillion

ADA Price Holds Critical $0.25 Support Level

Market focus has turned to the $0.25 level. Crypto analyst Ali Martinez highlighted that this zone is crucial for Cardano’s support. He pointed out that the same floor has played a big role in key rebounds in the past market cycles.

Martinez pointed to the monthly chart. In January 2023, ADA rebounded from $0.25 and later gained 88.27%. The same zone was held in September 2023, followed by a 243% price jump.

He noted that Cardano has now returned to its reaction phase again. If ADA continues to support at this level, his first target is $0.36. His secondary macro target is at $0.53.

ADA Price Analysis: Cardano Eyes Breakout as $0.25 Support Holds
Source: X

He also expressed caution on the downside. A $0.25 drop would be a sign of a more significant trend reversal. It may also pave the way towards a bigger correction.

According to Coinlore data, the price of $0.2483 recently served as a short-term support level. The first resistance level stands at $0.3119. If it rises from there, the next resistance level will be around $0.3508.

The third resistance level is seen at $0.3851. These levels provide a trader with a definite range to observe. The present price is still under the initial major resistance area.

Derivatives Activity Rises as Open Interest Climbs

Additionally, ADA price analysis indicates greater activity in the derivatives market. CoinGlass data shows the future volume increased 10.20% to $602.39 million. Open interest rose 6.51% to $557.80 million. The ADA OI-Weighted Funding Rate is at 0.0066%. 

Source: CoinGlass

ADA Price Analysis Shows EMA and BB Recovery Signals

From a technical perspective, the daily Exponential Moving Average (EMA) data shows short-term improvement. ADA trades above the 20-day EMA at $0.2566. It also stayed above the 50-day EMA at $0.2578.

Resistance is still seen ahead on the longer time frame EMA levels. The 100-day EMA stood at $0.2846. The 200-day EMA is higher at $0.3659.

The Bollinger Bands (BB) show that ADA is in the upper zone. The upper Bollinger Band is at $0.2846. The middle BB is at $0.2535, and the lower Bollinger Band stands at $0.2362.

Source: TradingView

However, ADA price analysis shows Cardano holding above an important support area. A break above $0.3119 would be a positive change in the recovery structure. If it drops below $0.25, it would create a weak setup.

This article contains market analysis and price predictions. These are not guarantees. Crypto markets are volatile. Always DYOR. Not financial advice.

Also Read: SEI Price Prediction: Breakout Formation Targets $0.76 as Bulls Regain Control

Filed Under: Cryptocurrency News, Cardano (ADA)

NEAR price Analysis: Strong Break Above $1.50 Signals Potential Surge to $3

By Mishal Ali | Edited By Messam Raza,May 9, 2026, 6:30 PM

NEAR Protocol (NEAR) is moving in an upward consolidation phase following the changing conditions in the crypto market. However, the NEAR price breakout is also supported by rising open interest. According to CoinMarketCap, as of Saturday, May 9, the NEAR is currently trading at $1.58, with the gain of 2.39% over the last 24 hours.

NEAR current price

Source: CoinMarketCap

NEAR Derivative Data Point to Increasing Strength

According to Coinglass, the NEAR open interest increased by 7.92% to $332.37 million, showing rising market engagement and new positions entering the derivatives market. This growth reflects heightened speculative activity and improved trader confidence, contributing to stronger liquidity and potential future volatility.

NEAR open interest and volume

Source: Coinglass

However, trading volume remained stable at $423.77 million, indicating consistent market activity and balanced participation from traders. The stability suggests no significant spikes or drops, reflecting steady liquidity conditions and ongoing interest in the asset.

Also Read: NEAR Protocol (NEAR) Consolidation Signals an Explosive Move to $1.85

NEAR Price Breaks $1.50 as Bulls Target $3 Rally

Furthermore, the data from Rand Group revealed that the NEAR price has surpassed the critical resistance level of $1.50, which has been the major barrier to any rise in price for a couple of weeks.

It is a clear indication that bulls have managed to soak up all the selling pressure and turn a resistance level into support.

NEAR price prediction

Source: Rand Group’s X Post

As long as $1.50 holds up, attention is focused on the next significant level at $3. The ability to maintain upward momentum and see strong volume will be essential in order to sustain the uptrend.

While retracements in the short term should not be entirely unexpected, optimism has increased due to expectations for a larger upward trend.

Technical Indicators Support Upward Potential

According to TradingView, the NEAR price is currently trading at $1.58660 and approaching the upper boundary of the Bollinger band.

The NEAR price experienced a decline in February to below $0.92 but soon recovered and continued on an uptrend, creating a series of higher lows. Currently, it continues to stay above its 1.38324 middle simple moving average (SMA).

NEAR price analysis

Source: TradingView

Technical indicators confirm that the trend is healthy. First, MACD has formed a positive crossover pattern, whereby the blue line has crossed the signal line in an upward move.

The rising bars of the green histogram show the growing buying pressure. Even though the price has risen a little too much towards the upper band, the outlook remains positive.

This article contains market analysis and price predictions. These are not guarantees. Crypto markets are volatile. Always DYOR. Not financial advice.

Also Read: NEAR Protocol Price Prediction: Is a Drop to $1.22 the Setup for a Strong Bounce?

Filed Under: Cryptocurrency News, Altcoin News

Bitcoin Price Consolidates Above $76K Support With Bullish Reversal Ahead

By Mishal Ali | Edited By Messam Raza,May 9, 2026, 5:30 PM

Bitcoin (BTC) is moving in an upward consolidation phase as it maintains its position above the key support level around $76. Furthermore, the Bitcoin price breakout is also supported by the institutional and strong whale activity. According to CoinMarketCap, as of Saturday, May 9, BTC is currently trading at $80,392.62, with signs of stability over the last 24 hours.

BTC current price

Source: CoinMarketCap

Bitcoin Price Holds $76K With Bullish Reversal in Focus

Furthermore, the crypto analyst Michaël van de Poppe highlighted that Bitcoin is currently holding a critical structure, but the $76K level remains essential support.

Staying above it helps preserve the broader upward trend, while a breakdown could weaken the rally. Market sentiment stays cautiously positive, with traders watching whether Bitcoin can maintain momentum after recovering from prior bearish phases.

Bitcoin price prediction

Source: Michaël van de Poppe’s X Post

Attention is also on the 50-week moving average above current prices, a key resistance zone in early bull-market recoveries. Historically, first rallies from bear cycles test this level before continuation.

A successful push higher could strengthen bullish conviction and potentially trigger renewed momentum across altcoins as market confidence improves.

Also Read: Bitcoin Price Holds $80,000 Support as Bulls Eye $100,000 Breakout Target

Technical Indicators Reinforce Positive Momentum

According to TradingView, the Bitcoin price is hovering at $80,340.67 as it bounces back on the bullish side, above the 20, 50, and 100-day EMAs.

While this suggests an overall bullish trend for the medium term, the immediate resistance for the Bitcoin price lies at the 200-day EMA of $82,030. Breaking above this level would confirm a solid bullish trend moving towards further gains.

BTC technical analysis

Source: TradingView

RSI is trading at 63.00, which indicates strong momentum for now and room to increase further before reaching the overbought zone. There is decent support near the level of $78,174, which correlates with the 20-day EMA.

Increasing lows after February show that buyers continue to be in control. These levels are critical to maintaining the trend in the ongoing consolidation near the $80,000 level.

Bitcoin Demand Increases as Whale Buys 2,500 BTC

Apart from the Bitcoin price movements, a new Bitcoin wallet starting with bc1qhx became the subject of interest after withdrawing 2,500 BTC, which is nearly $202.17 million, from Binance.

According to data from Lookonchain such a significant amount has been found on the blockchain in one transaction only, which immediately attracted the attention of the experts tracking large transactions of Bitcoin.

Bitcoin whale activity

Source: Lookonchain’s X Post

Withdrawals of such considerable amounts always indicate whale movements or long-term storage strategies rather than impulsive trading.

Investors keep a sharp eye out to check whether the funds will be used for cold storage or OTC trading. Though the exact intention is not known yet, it seems like another move aimed at reorganization of the cryptocurrency portfolio.

This article contains market analysis and price predictions. These are not guarantees. Crypto markets are volatile. Always DYOR. Not financial advice.

Also Read: Bitcoin Dominance Holds 60% as Market Consolidates Near $1.61 Trillion

Filed Under: Cryptocurrency News, Bitcoin (BTC)

NEAR Protocol Price Could Explode Toward $4 After Major Recovery Signal

By Bena Ilyas | Edited By Ammar Raza,May 9, 2026, 5:00 PM

NEAR Protocol price indicates that the asset is still struggling under a prolonged bearish structure despite early signs of short-term recovery. Despite short-term improvement, the broader market structure still reflects a sustained bearish phase dominated by lower highs and persistent selling pressure.

Currently, NEAR is trading around $1.57, which represents a 1.73% daily increase. NEAR recorded an approximate daily trading volume of $478.01 million while its market capitalization has fallen to $2.04 billion with a market dominance of 0.08%. At the same time, the asset continues trading significantly far below its previous cycle all-time high near $20.

NEAR price chart
Source: CoinMarketCap

Also Read | CRV Price Compression Hints at a Breakout With a $0.265 Rally in Focus

Market Structure Shows Extended Downtrend Phase

As per the recent market structure observation highlighted by Crypto Patel, the NEAR coin has been moving inside an extended descending price channel since reaching its previous all-time high. Over time, the market witnessed a series of lower highs and lower lows reflecting continuous bearish pressure.

NEAR price analysis
Source: Crypto Patel’s X Post

The price has found difficulty rising above certain resistance zones, with the price finding difficulty moving above the resistance near $2. Such resistance levels indicate that buying pressure had failed multiple times to push the price back above the higher level.

Meanwhile, according to the recent movement, NEAR Protocol price has already breached lower range lows and recovered relatively quickly from the lower level. Such price movement usually suggests an attempt from the crypto asset to stabilize itself as selling pressure slows down.

NEAR Protocol Price Invalidation Below $0.85

NEAR Protocol price highlights a critical support region between $0.85 and $1.20, where long-term accumulation may occur if the price revisits lower levels. This zone is considered important for potential demand buildup.

Meanwhile, a weekly closing under the critical support level of $0.85 indicates a weaker market structure and further downtrend in the future.

Furthermore, the recovery above $3.20 is required for confirming the shift in the trend direction to the upside. If the price fails to move above $3.20, then NEAR is likely to stay in a consolidation phase.

NEAR Protocol Faces Make-or-Break Moment

If NEAR remains stable above its accumulation zone, it is expected to recover initially toward short-term levels near $1.80 to $2.10, followed by higher resistance zones near $3.20. 

NEAR technical price analysis
Source: TradingView

On the flip side, a breakdown under the current support level means that the overall market structure remains vulnerable.

Overall, the NEAR Protocol price analysis reflects a market at a critical decision point where direction can depend on whether buyers can sustain momentum at current levels or whether sellers regain control.

This article contains market analysis and price predictions. These are not guarantees. Crypto markets are volatile. Always DYOR. Not financial advice.

Also Read | SEI Price Prediction: Breakout Formation Targets $0.76 as Bulls Regain Control

Filed Under: Cryptocurrency News

  • « Go to Previous Page
  • Page 1
  • Interim pages omitted …
  • Page 87
  • Page 88
  • Page 89
  • Page 90
  • Page 91
  • Interim pages omitted …
  • Page 3666
  • Go to Next Page »

Primary Sidebar

Recent Posts

  • ALGO Price Forecast: Can it Break Above $0.1319 Resistance? June 6, 2026
  • XRP Price Struggles at $1 Support While Bullish Cycle Targets Stay Locked at $5, $10 June 6, 2026
  • Galaxy Research Warns CLARITY Act Could Face Major Delays in 2026 June 6, 2026
  • Binance Coin Price Holds $570 as Resistance Triggers Market Uncertainty June 6, 2026
  • Professional Bitcoin Holdings Fall 17% as Hedge Funds Exit Positions June 6, 2026

Footer

News

  • Latest News
  • Altcoin News
  • Bitcoin (BTC)
  • Blockchain
  • Tron (TRX)
  • World

Digest

  • Meet the Founder
  • Price Winning Article
  • DeFi
  • Cyber Security
  • Crypto Scam

Industry

  • Project Review
  • Technology
  • Fintech
  • Tron Exchange
  • New in Town

Tron Universe

  • Event and Tron Parties
  • New in Town
  • Tron Tokens

FOLLOW US

  • Facebook
  • Telegram
  • Twitter
  • Linkedin

Subscribe US

Editorial Policy | Privacy Policy | Disclaimer | Terms and Conditions | Masthead

Copyright © 2026 · Tron Weekly. All Rights Reserved. NOTE: Tron Weekly is an independent crypto news site that adheres to the strict journalism policy anchored on transparency, trust, and objectivity, we have no affiliation with the TRON Foundation, its founder Justin Sun or any other cryptocurrency firm.