- Bitcoin (BTC) sharply rebounds after witnessing a sudden price cut to $10000 support area.
- BTC dominance is down by 71.96% following the past three days of bear surge
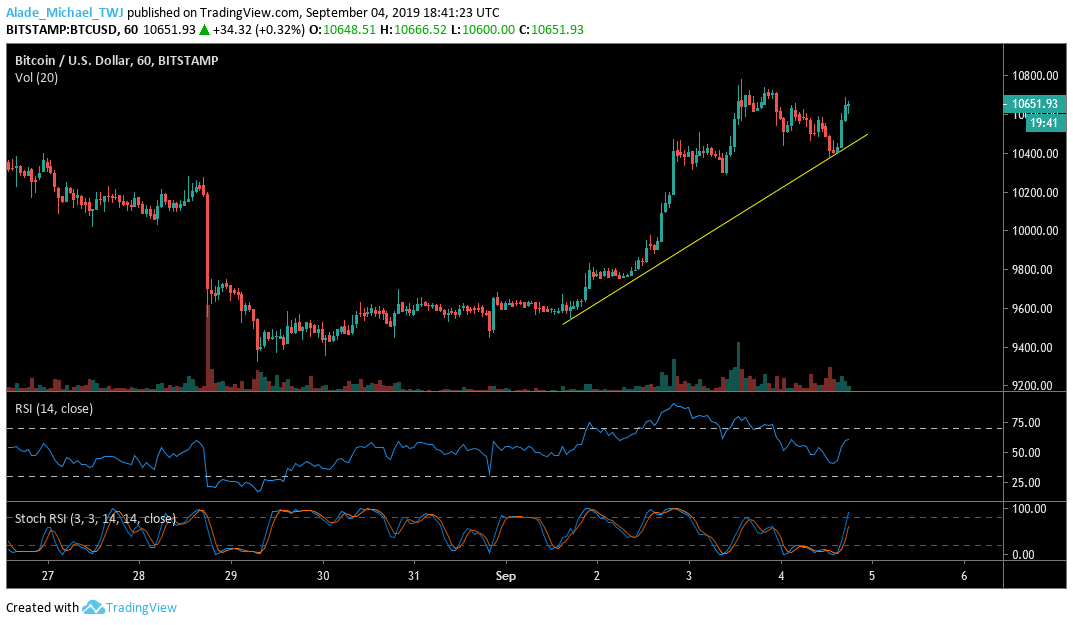
The intraday trading for Bitcoin has currently recorded a price drop of 0.79%, causing the price to trade at $10328 price level. Following a daily short opening, BTC has seen a sharp price cut to $10060 low (Bitstamp) with a quick recovery back to $10542 high.
Meanwhile, the $9000 support is still holding well and has remained an active defensive line for the bulls since July. Additionally, the $11000 is now acting as a critical resistance level for the market. However, if Bitcoin can manage to drop below the $10000 support on a daily close, Bitcoin may once again roll back to the$9000 zone.
Bitcoin’s Current Statistics
Trading Price: $10328
Market Capitalization: $185,878,222,262
Trading Volume: $16,155,142,758
Key resistance levels: $10542, $10850, $10949
Key support levels: $10000, $9800, $9500
Bitcoin Price Prediction for September 9, 2019
The daily chart for BTC dominance records 71.89% at the moment with a long-term bullish outlook. Following the past three days of the price drop, Bitcoin is currently testing the yellow ascending trend line, which is acting as a pennant support line since July 2.
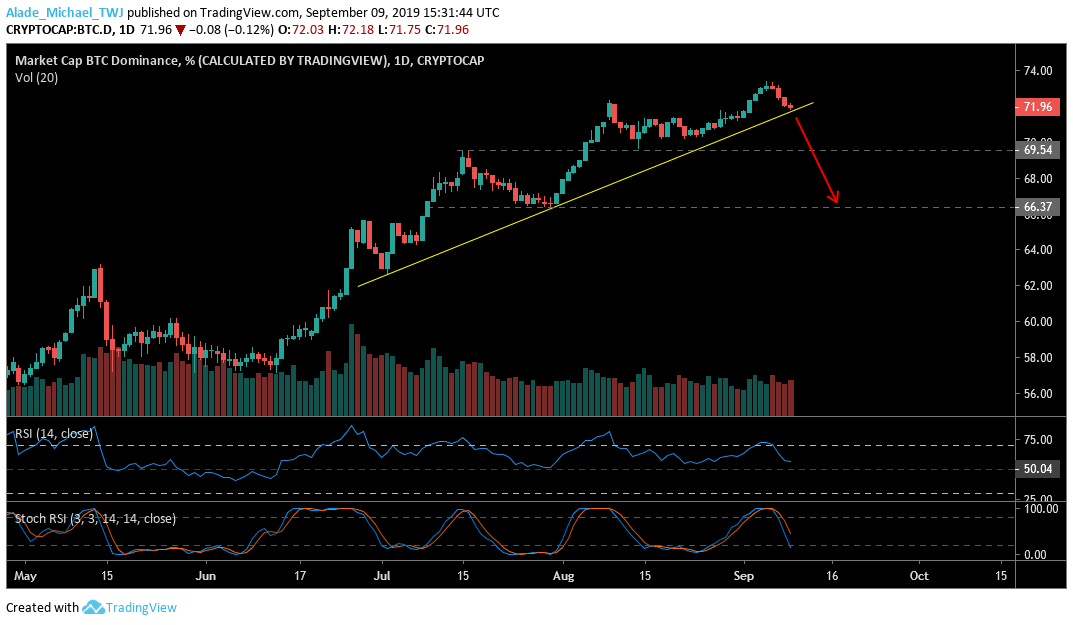
If the BTC dominance bounces back towards 73.38% – the September 5 drop level, the price of Bitcoin may climb back to $10542, $10850 and $10949 resistance. On the other hand, a break below the yellow line might cause a severe shrink in BTC dominance to 69.54% and 66.42% level. However, the closest crucial support for Bitcoin is $10000 level. A breakout may further slump price to $9800 and $9500 on a short-term.
Conclusively
Looking at the daily chart, BTC is getting weak as the market appears subdued with choppy price action. If Bitcoin continues to lose dominance, especially below 70%, the price may fall significantly, causing liquidity to flow into altcoins. However, an increase in dominance may cause the altcoins to shrink the more.
Technical Indicator Reading
The RSI for Bitcoin price is still showing a bullish momentum as it continues to find support at the mid-band; a break below the 50 level could lead to a severe bearish action in the market.
The Stochastic RSI is currently looking bearish due to the recent drop in BTC dominance. We can expect more drop if it reaches the oversold area.
Disclaimer: The presented information is subjected to market condition and may include the very own opinion of the author. Please do your ‘very own’ market research before making any investment in cryptocurrencies. Neither the writer nor the publication (TronWeekly.com) holds any responsibility for your financial loss.
Never miss our daily cryptocurrency news, price analysis, tips, and stories. Join us on Telegram | Twitter or subscribe to our weekly Newsletter.