• Skip to primary navigation
  • Skip to main content
  • Skip to primary sidebar
  • Skip to footer
  • About us
  • Write for us
  • Terms and Conditions
  • Privacy Policy
  • Disclaimer
  • Contact
  • All Posts
  • Advertise

TronWeekly

Crypto World News

  • Home
  • Education
    • Best TRON Wallets
    • Beginner’s guide to TRON
  • Opinion
    • Tron Tokens
    • Market Analysis
  • Industry
    • Tron Exchange
    • Project Review
  • Press Release
  • Advertise
  • About us
    • The Team
    • Editorial Policy
    • Write for us
    • Privacy Policy
    • Disclaimer
    • Terms and Conditions
    • Contact
You are here: Home / Archives for ethereum price chart

ethereum price chart

Ethereum May Still Cross $500 in September, Here’s Why

September 3, 2020 by Utkarsh Gupta

The volatility reflected on Ethereum’s chart was for everyone to see in the current market. After registering a value of $289 on 1st September 22:00 UTC, the price unceremoniously dipped down to $420, just 11 hours later. The larger ecosystem believed that the resistance implied just below $500 is possible too much to handle for Ethereum. According to Santiments’ recent data on Twitter, its Daily Active Addresses were under a severe decline as well.

ethereum news

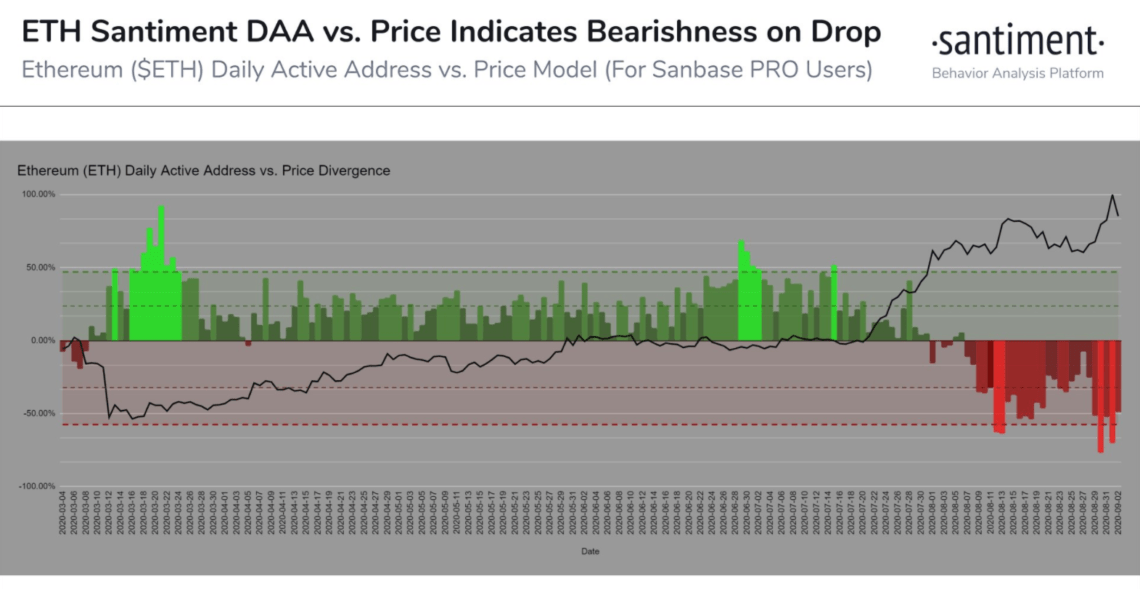
The analytics platform believed that the largest altcoin has been indicating weak fundamentals all-throughout August and that’s why the bullish sentiment was quickly flushed over the past 24-hours. They stated,

“Daily Active Addresses vs Price Model continues to show a clear deficit in address activity to justify ETH traders’ bullish euphoria quickly faded.”

However, it is likely that Ethereum’s fundamental weakness might not stop the altcoin’s pursuit of attaining a position above $500.

Deribit ETH options record new highs 

According to Deribit’s recent institutional newsletter, Ethereum concluded a drastically positive period for itself in terms of Options activity. The exchange stated that the total turnover registered by ETH Options topped $15 billion in August 2020, which was 44% more than in July 2020.

ethereum analysis

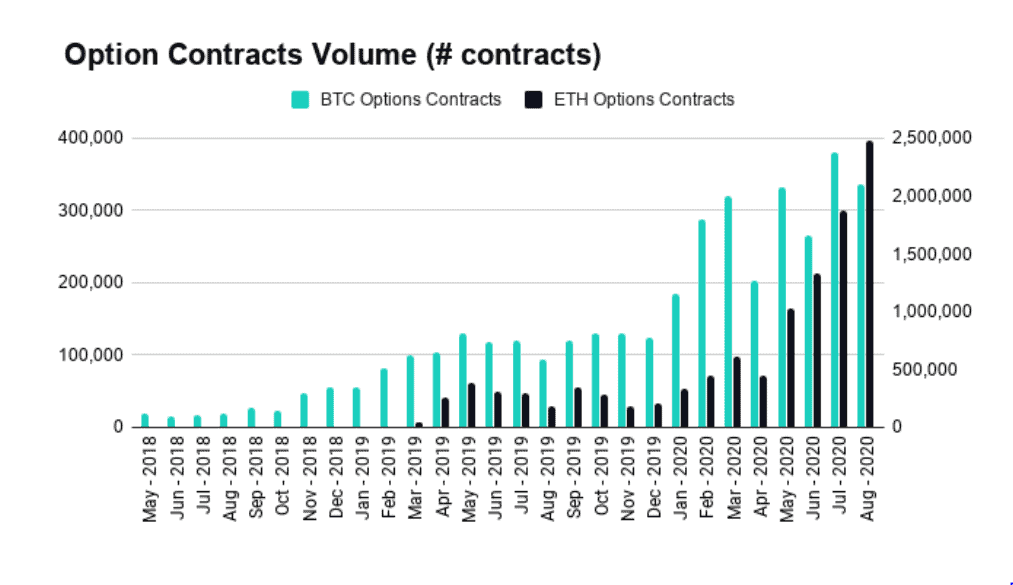
The number of ETH option contracts recorded was also an all-time high with 2,477,195 ETH contracts traded, up by 32% from July 2020. If the chart above is observed closely, it can be pictured that ETH activity has slowly eclipsed Bitcoin‘s on Deribit in August 2020.

The bullish sentiment attached to Ethereum was verifiably strong in spite of the massive price dump 24-hours before.

How does Sentiment help Ethereum now?

It is extremely important to understand that the lack of Daily Active Addresses has also been a price blessing for Ethereum. The decline of DAA is in direct correlation with the usage of DeFi, as the congestion was pricing out unique transactions taking place on the network.

However, the benefits are evidently being noticed with ETH attaining yearly-highs on a consistent basis.

ethereum price

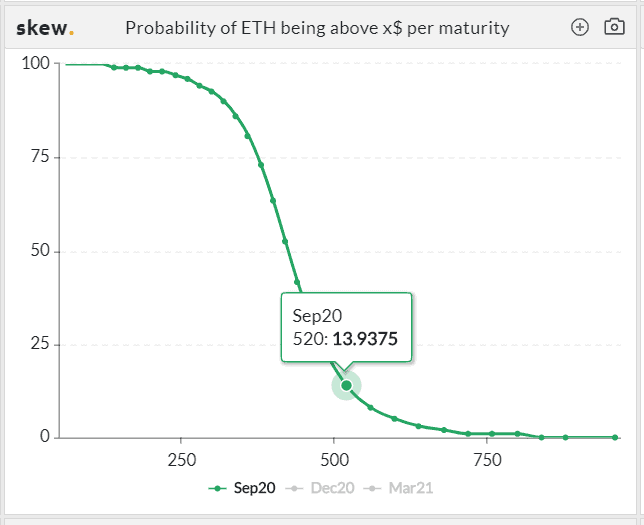
At the moment, the probability of Ethereum closing above $520 is 14%. In comparison, the probability in July was only 3%, which means that the bullish sentiment was reciprocated strength in spite of weak fundamentals.

In the long-run, it can be detrimental for Ethereum’s adoptions and organic growth is vital for long-term sustenance but for the time being, price-performance meant everything to the market, and Ethereum is standing strong on those foundational grounds.

Filed Under: Altcoin News, News Tagged With: altcoin news, ETH, Ethereum (ETH), Ethereum news, ethereum option contract, Ethereum Price, ethereum price chart

Ethereum Price Prediction: Bullish Pennant May Push ETH Above $335

July 29, 2020 by Utkarsh Gupta

Ethereum Price Prediction

The price of Ethereum has been on a roll over the last week.  The largest altcoin asset registered its highest weekly hike of 40 percent, surpassing multiple key resistances in the process. The asset was able to gather momentum before Bitcoin itself and currently held its own at the upper end of the price point.

ETH has already taken over its previous yearly high of $289, contributing to an uncharted trading range for the year. At the moment, Ethereum is valued at $318 with a market cap of just under $36 billion.

ETH 1-day chart

ethereum price prediction

The long-term chart of Ethereum describes the recent breakout that took place on the 22nd of July. For over a month, Ethereum’s valuation maintained movement between the trendlines of an ascending triangle. After a bullish squeeze development from 20th-22nd July, the price breached out of the pattern and surged in the charts.

Resistances at $276 and $304 were surpassed in the process, as a new yearly high was registered. After seven days of consecutive green candles, Ethereum witnessed a minor setback on 28th July, but the asset continued to maintained movement between the range of $335 and $318.

The 50-Moving Average continued to be above 100-Moving Average, indicating a strong bullish trend at the moment.

ETH 4-hour chart

ethereum bullish

Now, even though Ethereum had registered a decline in charts in the last few hours, another bullish pattern in the chart that help the asset re-test resistance at $335. As shown in the 4-hour chart, a bullish pennant is taking place in the charts and a positive upward trend following a pattern breach may allow Ethereum to ascend towards $335.

$335 was the yearly high registered during the rally of 2019 hence surpassing that price point who indicates Ethereum’s highest position in the past one year.

The decreasing trading volume alongside the price drop over the past day is suggesting bullish divergence as well.

ethereum price chart

The market indicators for ETHwere contrasting bu insightful. MACD on the 4-chart was unsurprisingly bearish due to the current correction period but for Ethereum’s Relative Strength Index, it was a different situation.

The RSI continued to remain under the momentum of buying pressure and the index appeared to undergo an incline again. A trend reversal is possibly approaching as ETH catches its breath in the market.

For ETH, the time is perfect to surge above $335, before a major correction period takes over.

Filed Under: Altcoin News, News Tagged With: Ethereum 2.0, ethereum bullish, ethereum market cap, Ethereum Price, ethereum price chart, Ethereum Price Prediction, ethereum valuation

Primary Sidebar

Recent Posts

  • BeFaster.fit bets big on emerging markets like India as application launch draws near February 26, 2021
  • Kraken Intends To Value Firm Over $10B By Raising Capital Through Fidelity February 26, 2021
  • Tron’s [TRX] Strong Sellers’ Sentiment Could Hinder Its Growth February 26, 2021
  • Bitcoin Slumps Down To $45K; Will The King Coin Ever Hit $60K? February 26, 2021
  • Bitcoin, Ethereum, And Other Coins Find Shelter At 177-Year-Old Bank February 26, 2021


Footer

News

  • Altcoin News
  • Bitcoin News
  • Blockchain
  • Tron News
  • World

Digest

  • Meet the Founder
  • Price Winning Article
  • DeFi
  • Cyber Security
  • Crypto Scam

Industry

  • Project Review
  • Technology
  • Fintech
  • Tron Exchange
  • New in Town

Tron Universe

  • Event and Tron Parties
  • New in Town
  • Tron Tokens

Follow Us

Subscribe US

Copyright © 2021 · Tron Weekly. All Rights Reserved. NOTE: Tron Weekly is an independent crypto news site that adheres to the strict journalism policy anchored on transparency, trust, and objectivity, we have no affiliation with the TRON Foundation, its founder Justin Sun or any other cryptocurrency firm.