• Skip to primary navigation
  • Skip to main content
  • Skip to primary sidebar
  • Skip to footer
  • About TronWeekly
  • Write for us
  • Terms and Conditions
  • Privacy Policy
  • Disclaimer
  • Contact
  • All Posts
  • Advertise

TronWeekly

Crypto World News

  • Home
  • Latest News
  • Opinion
    • Education
    • Best TRON Wallets
    • Beginner’s guide to TRON
    • Tron Tokens
    • Market Analysis
  • Industry
    • Tron Exchange
    • Project Review
  • Press Release
  • Bitcoin (BTC)
  • Ripple (XRP)
  • Advertise
  • About TronWeekly
    • The Team
    • Editorial Policy
    • Write for us
    • Privacy Policy
    • Disclaimer
    • Terms and Conditions
    • Contact
You are here: Home / All Posts

All Posts

SAND Price Outlook: Falling Wedge Pattern Hints at Recovery Toward $1.45

By Sadia Ali | Edited By Messam Raza,May 19, 2026, 7:00 AM

The Sandbox (SAND) is trading in a falling wedge with weakening bearish momentum and rising activity; despite a strong downtrend below key moving averages and weak RSI, increased volume and stable open interest suggest accumulation, leaving potential for a bullish breakout for the SAND price if support holds.

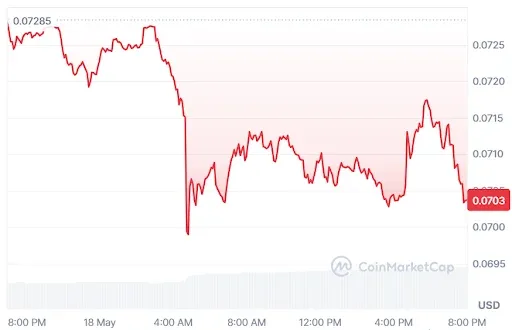
At the time of writing, SAND is trading at $0.07043 with a 24-hour trading volume of $37.35 million and a market capitalization of $206.65 million. Despite posting a 3.17% decline over the last 24 hours, rising trading volume and easing pressure point to a breakout in the coming sessions.
SAND Price chart

Source: CoinMarketCap

SAND Price Could Surge to $1.45 If Support Holds Strong

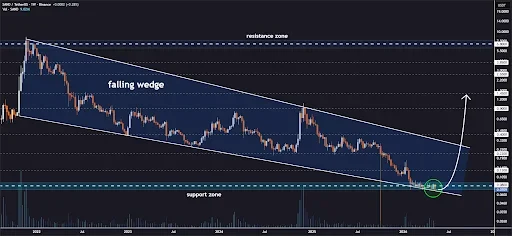
According to crypto analyst Jonathan Carter, the SAND price is showing a notable technical structure on the weekly chart, with the price respecting a long-standing falling wedge pattern. 

After extended downside pressure, the SAND price is repeatedly finding support at the lower boundary, suggesting weakening bearish momentum and gradual accumulation. Buyers are beginning to stabilize price action within this key zone.
SAND Price Could Surge to $1.45 If Support Holds Strong

Source: Jonathan Carter’s X Post

In case the pattern remains intact, a bullish breakout could emerge, pointing toward the possibility of a recovery in the near future. 

The SAND price objectives include $0.13, $0.22, $0.40, $0.90, and $1.45, depending on how much momentum will be demonstrated by the market. However, in case of failure of support level for the wedge pattern, the whole idea would become invalid.

Also Read: The Sandbox (SAND) Accumulation Could Drive The Price Toward $0.085

Technical Indicators Point to Bearish Dominance

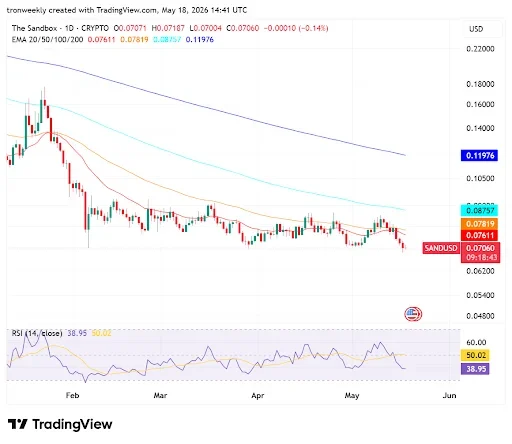
According to TradingView, the SAND price is on a strong downward trend, continuously forming lower tops and bottoms. 

Its price is trading well below its 20-day, 50-day, 100-day, and 200-day EMAs, thus making a perfect example of a bearish crossover pattern. Currently, the asset is heading towards support at $0.07060.
Technical Indicators Point to Bearish Dominance

Source: TradingView

The relative strength index is standing at 38.95, moving below its yellow signal line of 50.02. It is indicative of bearish sentiment that has not yet reached oversold conditions. 

In addition, the short-term EMAs are hugging each other near the top, providing solid overhead resistance that does not allow even the briefest of rallies to occur.

SAND Derivative Data Point to Improving Strength

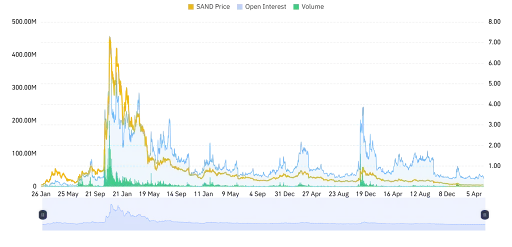
However, the trading volume went up to $36.60 million, an increase of 111.74%, which is indicative of active participation in the market by traders due to changes in prices and general sentiment prevailing in the market.
SAND Derivative Data Point to Improving Strength

Source: Coinglass

The open interest increased slightly by 1.09% to stand at $26.46 million. The slight increase reflects consistency in the positions held by market players despite the fluctuations in trading volumes and expectations.

This article contains market analysis and price predictions. These are not guarantees. Crypto markets are volatile. Always DYOR. Not financial advice.

Also Read: SAND Price Forecast: Break Above Resistance Could Trigger Move to $0.65
Filed Under: Cryptocurrency News, Altcoin News

DOGE Price Prediction: Accumulation Phase Points to an Explosive Move to $3

By Sadia Ali | Edited By Messam Raza,May 19, 2026, 6:00 AM

Dogecoin is being viewed as shifting toward stronger ecosystem-driven growth beyond hype cycles. Traders see accumulation zones and long-term bullish potential, but major upside depends on favorable market conditions. Short-term momentum remains weak for the DOGE price, with selling pressure and technical indicators suggesting continued decline.

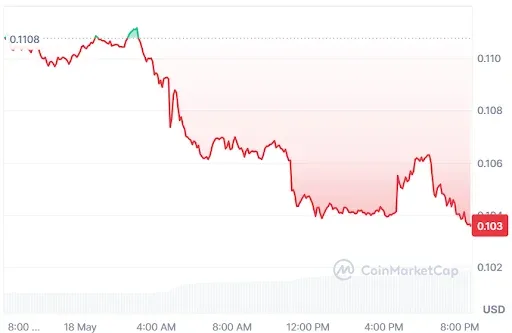
At the time of writing, DOGE is trading at $0.1034 with a 24-hour trading volume of $17.62 billion and a market capitalization of $17.62 billion. Despite posting a 6.16% decline over the last 24 hours, the DOGE price could hold its long-term accumulation ground to pave the way to new highs.

DOGE price chart

Source: CoinMarketCap 

Also Read: Dogecoin Price Could Rebound Toward $0.15 if Buyers Regain Momentum

DOGE Price Accumulation Point to Explosive Run to $3

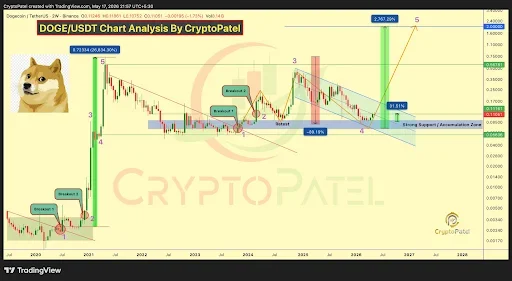
According to the crypto analyst Crypto Patel, the narrative around Dogecoin is shifting again as the DogeOS founder claims the asset is gradually moving beyond its historical dependence on Elon Musk’s influence. 

Instead of reacting mainly to social media hype, Dogecoin is being framed as developing its own ecosystem strength, community activity, and longer-term market structure within the evolving crypto landscape.

DOGE Price Accumulation Point to Explosive Run to $3

Source: Crypto Patel’s X Post

Accumulation areas ranging from $0.07 to $0.10 are currently being discussed by traders, who consider them as potential entry points for long-term investments amid the ongoing consolidation phase. 

Speculative expectations are that the DOGE price could reach the levels of $1, $2, and even $3 during this year’s strong alt-season. The ability to achieve such price levels will depend on market liquidity and bullish momentum.

The main issue here is that the DOGE price might actually achieve $2 in the next cycle. Previous rallies show that it has the capability of making big moves. 

However, for that to happen, there needs to be an exceptional market environment and good demand. Ultimately, it comes down to how long Dogecoin will remain relevant past the hype moves.

DOGE Faces Pressure Below Key Moving Averages

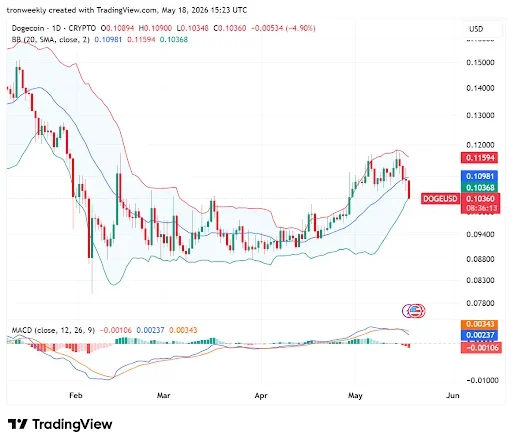
According to TradingView, the DOGE price witnessed a sharp decline in the month of March and maintained its range in April within a tight trading band of $0.08800 to $0.09400. 

A bullish sentiment pushed the DOGE price to reach an upward level of $0.11594 in May, but a swift decline of -4.90% erased its gains recently. Its current price is $0.10360.

DOGE Faces Pressure Below Key Moving Averages

Source: TradingView

The DOGE price fell below the middle Bollinger Band at 0.10981 and is quickly approaching the lower band at 0.10368 due to rising volatility. 

The downtrend is also confirmed by the MACD falling below the signal line into negative territory at -0.00106. The new crossover shows that the downside momentum is picking up, which means more downswings are expected.

This article contains market analysis and price predictions. These are not guarantees. Crypto markets are volatile. Always DYOR. Not financial advice.

Also Read: Dogecoin Price Signals Major Breakout Potential as DOGE Targets $0.15

Filed Under: Cryptocurrency News, Altcoin News

Ethereum Foundation Faces Growing Wave of Leadership Resignations

By Zagham Abbas | Edited By Messam Raza,May 19, 2026, 5:00 AM

Ethereum Foundation is back in the headlines as Carl Beek and Julian Ma, two key members, have announced their resignation. This follows an established trend of resignations at the Foundation, raising new concerns in the crypto world about the future of one of the leading organizations in the cryptocurrency space.

Life Update: I have decided to leave the Ethereum Foundation. I’m very grateful to have worked with so many talented and inspiring people on an incredibly important project over the past four years.

I’m proud of the work we’ve done. Here are some of my personal highlights:

-…

— Julian (@_julianma) May 18, 2026

However, the Ethereum Foundation has been facing more scrutiny in recent months following a series of departures of prominent individuals. This continued trend has raised the suspicion that there may be bigger issues brewing within the Foundation as the Ethereum project scales to become a global blockchain network.

Also Read | Ethereum Exploit: Verus-Ethereum Bridge Suffers $11.4 Million Hack

Ethereum Foundation Faces Growing Leadership Turnover

Beek and Ma are just two individuals among others who have left as a result of the trend towards departure from the Foundation, as a result of the development and coordination activities that have been associated with it. Previously, other known individuals like Barnabé Monnot and Tim Beiko had also left their positions.

Among other exits, there is also that of Trent Van Epps, an important person behind the creation of the Protocol Guild, a funding body that later went on to form a separate support network for the Ethereum core team. Alex Stokes, previously a co-leader of an important protocol project, recently decided to take a break from the space.

Among such posts, one notable example is that made by an anonymous user @DefiIgnas on the X platform, who highlighted the reasons for “so many people leaving the Ethereum Foundation.”

What's happening at the EF?

At least 5 high profile EF contributors publicly announced their departures within a month. How many not public?

And why?

Stopped believing in Ethereum? Pay is low and competitors paying more? Or just tired?

Would love to know the REAL reasons… pic.twitter.com/hJ6kTYIbgP

— Ignas | DeFi (@DefiIgnas) May 18, 2026

This is happening in the midst of the Ethereum Foundation’s own larger strategy shift, as announced earlier this year when the Ethereum Foundation laid out a new mission statement, which made it clear that it is not a governing body but just one of the many groups supporting the research and development process in Ethereum.

Ethereum Foundation Future Under Question

In addition to that, the revised mandate for the Ethereum Foundation highlighted some important core values like censorship resistance, privacy, open source, and security. The mandate also proposed that with the maturing of Ethereum, there should be a gradual decline in the role of the Ethereum Foundation.

Restructuring of the leadership is yet another factor that has influenced this process. Tomasz Stańczak, who had been working for the Ethereum Foundation as the co-executive director since the organization underwent a restructuring phase in 2025, recently announced his resignation from the post, having worked there for a relatively brief period of time.

With the Ethereum Foundation still figuring out how it should be structured internally, as well as the role it is supposed to play in relation to the platform, there are concerns that all the departures will make it impossible for it to keep things together while ensuring the development of Ethereum in the long run.

Also Read | Tom Lee Says Ethereum Price Outlook Can Strengthen Through 2026

Filed Under: Cryptocurrency News

XLM Price Eyes Rally Toward $1.29 as Stellar Gains Institutional Momentum

By Sadia Ali | Edited By Messam Raza,May 19, 2026, 4:30 AM

Stellar (XLM) is consolidating in a key zone with potential bullish momentum building if a breakout occurs, which could lead to a strong upward move for the XLM price. Market activity shows rising interest but mixed conviction, while Stellar continues expanding real-world financial use cases through institutional adoption.

At the time of writing, XLM is trading at $0.1466 with a 24-hour trading volume of $126.49 million and a market capitalization of $4.91 billion. Despite posting a 2.9% decline over the last 24 hours, rising trading volume and Stellar’s real-world adoption point to a strong breakout ahead.

XLM Price chart

Source: CoinMarketCap

XLM Price Eyes Massive Breakout Toward $1.29

According to the crypto analyst Javon Marks, XLM, the native token of Stellar, is currently holding a technically significant zone that could trigger a strong upward continuation. 

If momentum builds and resistance breaks, the XLM price action may accelerate toward the first major target near $0.681, signaling renewed bullish strength and a potential shift in overall market sentiment.

XLM Price Eyes Massive Breakout Toward $1.29

Source: Javon Marks’ X Post

A breakout beyond $0.681 could bring in the scope for even bigger gains for the XLM price, with technical experts looking to test the $1.29 level next. 

This would be quite a big run along the current pattern, but validation will be required before anything is confirmed. In the meantime, the XLM price remains well within its consolidation phase.

Also Read: State Street and Galaxy Launch SWEEP Tokenized Fund on Stellar as XLM Targets $0.55

Increasing Trading Volume Points to Bullish Reversal

However, the XLM volume rose by 87.83% to $187.20 million, implying high trading volumes and increased participation in the market. The increase is indicative of increasing investor interest, better liquidity, and potentially higher volatility in the market.

Increasing Trading Volume Points to Bullish Reversal

Source: Coinglass

Open interest fell by 6.92% to reach $103.37 million, suggesting lower capital commitment and fewer positions taken. This fall may be an indicator of profit booking, risk-averse trading attitude, or weakening short-term conviction.

Stellar Powers Bermuda’s Financial Services Shift

The data from Stellar further highlighted that the Stellar Development Foundation, along with the Bermuda government, is planning on shifting the critical payments and financial services operations on the Stellar blockchain network. 

This step highlights the efforts by Bermuda in moving towards updating its financial infrastructure using distributed ledger technology for fast, efficient, and transparent settlements.

Stellar Powers Bermuda’s Financial Services Shift

Source: Stellar

The project aims at positioning Stellar as a backbone in the world of finance by moving from experimentation to actual use cases. 

By integrating on-chain applications into the processes of government departments, Bermuda hopes to achieve faster payments and increased interoperability. This would prove to be a good case study for other governments looking to improve their financial systems using blockchain technology.

This article contains market analysis and price predictions. These are not guarantees. Crypto markets are volatile. Always DYOR. Not financial advice.

Also Read: XLM Price Forecast: Can Bulls Trigger a Recovery Rally Toward $0.328?

Filed Under: Cryptocurrency News, Altcoin News

Will BONK Price Reach $0.0000070 by May End as Ledger Campaign Boosts Momentum?

By Athulyamol VS | Edited By Ammar Raza,May 19, 2026, 4:00 AM

BONK Price is showing signs of a potential shift after holding steady for the past month with no trading activity above its previous highs due to a lack of buying pressure. At press time, the coin is trading at approximately $0.0000059 with a decrease of around 5.8% over the past 24 hours.

BONK Price Holds Above $0.0000058 Support

According to the data from TradingView, BONK reached a high of $0.0000123 and subsequently retreated to a low of $0.0000082 (which corresponds to the previous resistance level) before recovering back toward $0.0000090 on May 1st, maintaining its broader upward structure over the past two months.

Although the overall price structure appears stable at present, the ability for BONK’s price to recover and retain its current range may depend on strong support remaining above $0.0000058 and positive momentum returning before the end of May/beginning of June.

If momentum returns, there is a possibility for BONK’s price to reach another potential high (likely between $0.0000070 and $0.0000074) and/or begin forming a new support base.

The most recent trading activity indicates that BONK price is continuing to hold above the significant support areas of $0.0000058 and $0.0000060 while the Relative Strength Index (RSI) has decreased towards level 37 which signifies that short-term momentum may be weakening prior to a further upward movement.

However, the RSI is likely approaching levels where buyers may become interested in re-entering the BONK market as long as current support levels are held by market participants; conversely, the On-Balance Volume (OBV) appears to have remained relatively stable during BONK’s downward trend and will be key to monitoring the strength of any future price action in BONK.

BONK price analysis
Source:TradingView

Also Read: BONK Price Forecast: Bullish Structure Points to a Rally Toward $0.0000090

BONK Price Community Activity Remains Strong

A recent announcement from the BONK X official account mentioned strong levels of participation for their Ledger giveaway. Their post contains the information that they’ve already had

“over 14,000 entries” and also prompts people to continue entering until they end their campaign.

The announcement also continues to demonstrate ongoing community participation within the BONK ecosystem, as meme coins are quite reactive to social media, and ongoing community participation campaigns will help sustain short-term visibility and speculative interest in the token.

Over 14,000 people signed up to get their paws on a $20k split pool and win a free BONK @Ledger.

Its time to check your email and confirm your entry❗❗❗ https://t.co/causuqPYAJ

— BONK!!! (@bonk_inu) May 18, 2026

Currently, the BONK price continues to remain in consolidation while trying to establish support above current levels with strong ongoing community activity and improving momentum indicators which could support the upcoming re-test of the resistance level.

Nevertheless, the overall crypto market has remained very much unstable, and price action could be greatly affected by the overall market sentiment.

This article contains market analysis and price predictions. These are not guarantees. Crypto markets are volatile. Always DYOR. Not financial advice.

Also Read: BONK Price Analysis: Bullish Breakout Targets Higher Resistance at $0.94

Filed Under: Meme Coins, Altcoin News, Cryptocurrency News

Cardano Price Could Rally Toward $2.67 Amid Rising Institutional Interest

By Sajjal Ali | Edited By Ammar Raza,May 19, 2026, 3:30 AM

Cardano (ADA) remains above key support, signaling strong buyer confidence and possible breakout potential for the Cardano price. Rising trading activity reflects growing investor interest, while ADA’s inclusion in a new crypto futures index by CME Group and Nasdaq strengthens institutional recognition.

At the time of writing, ADA is trading at $0.2520 with a 24-hour trading volume of $444.28 million and a market capitalization of $9.12 billion. Despite posting a 1.88% decline over the last 24 hours, rising trading volume and ADA’s institutional recognition point to a strong breakout ahead.

ADA current price

Source: CoinMarketCap

Cardano Price Defends Crucial Support Zone

According to the crypto analyst Jonathan Carter, the Cardano price continues holding above the lower boundary of its weekly descending triangle, signaling strong buyer support despite ongoing market volatility.

Analysts say the structure remains technically healthy, with repeated defenses of the support zone suggesting accumulation activity. As long as the Cardano price maintains this level, bullish sentiment surrounding a potential breakout scenario is expected to strengthen.

Cardano price prediction

Source: Jonathan Carter’s X Post

Market traders are now watching several upside targets if the Cardano price confirms a breakout from the triangle pattern. Key resistance levels for the Cardano price include $0.330, $0.515, $0.810, and $1.275, while long-term projections extend toward $2.670.

Growing optimism across the altcoin market has increased attention on the Cardano price setup and possible trend reversal.

Also Read: Cardano Price Update: Is ADA Price Preparing for a Breakout Toward $0.42?

Rising Trading Volume Points to Upcoming Breakout

However, the trading volume for ADA skyrocketed by 106.17% to touch $624.58 million, indicating the onset of heavy trading activities and market participation. Such an increase in trading volume indicates increased interest on the part of traders, which could be triggered by recent price action or market news.

Cardano open interest and volume

Source: Coinglass

Open interest fell 1.55% to $508.64 million, representing a slight pullback in the inventory of derivatives. This indicates that some traders may be unwinding their positions or reducing their exposure. This is happening despite the sharp rise in trading volumes.

Cardano Joins CME and Nasdaq Crypto Futures Index

The data from the crypto analyst Mintern further highlighted that the CME Group and Nasdaq are launching a new crypto index futures contract on June 8, offering institutional investors an opportunity to gain exposure to the entire crypto market in one contract based on market capitalization.

This index will track Bitcoin, Ethereum, Solana, XRP, Cardano, Chainlink, and Stellar, indicating that institutions are becoming increasingly comfortable with crypto adoption globally.

Cardano Inclusion in crypto index futures

Source: Mintern’s X Post

The high ranking of Cardano among leading cryptos serves as an indication of the importance of ADA in the ever-changing blockchain environment.

The introduction of a regulated futures contract is seen by analysts as a way of attracting hedge funds, asset management companies, and trading firms in search of easy access to cryptocurrency baskets. It also indicates increased collaboration between traditional finance and digital assets.

This article contains market analysis and price predictions. These are not guarantees. Crypto markets are volatile. Always DYOR. Not financial advice.

Also Read: Cardano Price Holds $0.25 Support as Wealth Tech Forum Sparks Optimism

Filed Under: Cryptocurrency News, Cardano (ADA)

Bitcoin Falls From $82K to $76K Amid Weak ETF Demand

By Amrin Sanjay | Edited By Ammar Raza,May 19, 2026, 3:00 AM

Bitcoin witnessed a sharp correction after briefly climbing above the $82,000 level, with the cryptocurrency later falling into the mid-$76,000 range. Analysts pointed to weakening spot demand, slowing ETF inflows, and reduced speculative activity as the main reasons behind the decline. The latest market data also showed that investors became more cautious following a strong rally earlier in the month.

$BTC rolled over from a local peak above $82K into the mid-$76Ks, with spot demand, ETF flows, and speculative positioning weakening. Long-term holder strength remains a key source of support.

Read this week’s Market Pulse👇https://t.co/SdBsPOUhJg pic.twitter.com/8Jn3I25EDk

— glassnode (@glassnode) May 18, 2026

Bitcoin Rally Loses Momentum After $82K Peak

Bitcoin was gaining traction after there was renewed hope regarding crypto regulations and institutional involvement due to prices moving beyond $82,000. Investors anticipated further gains since spot Bitcoin ETFs had been witnessing massive inflows before that time. But the uptrend lost steam once new money flowing into the market started to slow.

According to market analysts, speculative demand declined considerably during the upward trend. Funding rates on derivative exchanges also showed signs of cooling, suggesting the absence of any bull momentum from traders. As such, Bitcoin had difficulty maintaining its elevated price level and ultimately declined amid the increase in selling pressure.

The fall in prices was further hastened by the move of investors to lock in gains around the recent peak. Reports indicated that short-term traders, who had participated in the upward trend, had begun unwinding their positions due to volatility.

Bitcoin rally loses momentum after $82K peak
Source: glassnode

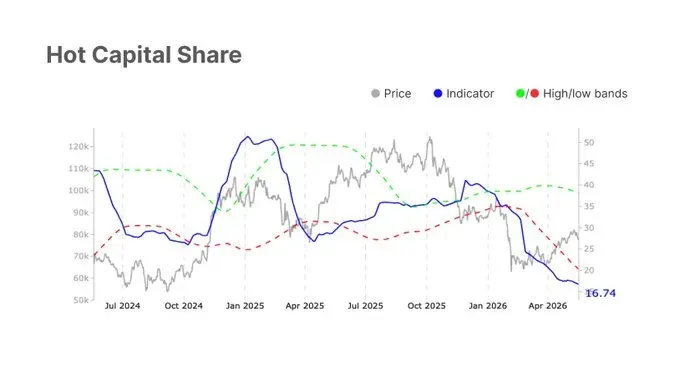
Glassnode data suggested that “hot capital,” or short-term speculative money, had started decreasing. The report indicated that fewer new buyers were entering the market compared to earlier phases of the rally. This trend often signals reduced momentum in fast-moving crypto markets.

Also Read: Strategy Bitcoin Purchase Adds 24,869 BTC, Holdings Reach 843,738 BTC

ETF Inflows Show Signs of Weakening

Spot Bitcoin ETFs had been one of the major drivers behind Bitcoin’s rally over the past several months. Institutional investors used these products to gain exposure to Bitcoin without directly holding the asset. However, recent data showed ETF inflows slowing compared to earlier weeks.

Analysts believe weaker ETF demand reduced buying support in the market. Lower inflows mean fewer new purchases of Bitcoin by ETF issuers, which can directly impact market liquidity. This slowdown contributed to the recent correction from the $82,000 level.

Despite the recent slowdown, ETF activity remains significantly higher than levels seen before spot Bitcoin ETFs were approved. Long-term investors continue to view ETFs as an important bridge between traditional finance and digital assets. Even so, short-term fluctuations in inflows can heavily influence BTC price movements.

Long-Term Holders Continue to Provide Support

Although the short-term demand trend was bearish, the long-term Bitcoin holders managed to demonstrate some stability during the market correction. According to the on-chain metrics, a considerable number of long-term investors decided to hold on to their positions instead of selling out amid the market fluctuations.

In fact, analysts have identified that the long-term holder supply is still relatively high despite the drop in the market. It appears that long-term investors who believe in BTC’s potential tend not to be impacted by its short-term movements.

Glassnode’s market analysis also highlighted that unrealized profits among long-term holders remain healthy. Even after BTC’s decline to the mid-$76,000 range, many investors are still sitting on significant gains from earlier cycles. This reduces panic selling compared to previous bear market phases.

Market Volatility Reflects Changing Investor Sentiment

BTC’s recent price swings once again highlighted the volatility of the cryptocurrency market. Rapid gains followed by equally sharp declines remain common, especially during periods of heightened speculation. The move from above $82,000 to below $77,000 occurred within a relatively short timeframe.

Investors closely monitored trading volumes and derivatives activity during the correction. Falling open interest and weaker funding rates suggested traders were reducing leveraged positions. This often happens when confidence in continued upside momentum starts fading.

This article contains market analysis and price predictions. These are not guarantees. Crypto markets are volatile. Always DYOR. Not financial advice.

Also Read: Iran Launches Hormuz Safe Platform Settling Maritime Insurance in Bitcoin

Filed Under: Cryptocurrency News, Bitcoin (BTC)

PENGU Price Gains Attention After Pudgy Penguins Launches 3% Cashback Card

By Athulyamol VS | Edited By Ammar Raza,May 19, 2026, 2:00 AM

PENGU price has gained market attention as a result of new initiatives introduced by Pudgy Penguins in association with the new cashback cards program that will reward users with up to 3%. Traders are watching to see whether the token can maintain its recovery trend. At press time, the coin is trading at $0.00818 with a decrease of nearly 2.7% over the past 24 hours.

Pudgy Penguins Launches 3% Cashback Card

In a recent post on X, Pudgy Penguins shared details about its new cashback card system with the message, “Earn up to 3% cash back,” alongside three reward tiers: “Standard,” “Premium,” and“Private.”

Pudgy Penguins is working on broader consumer utility aside from their NFTs, which is shown through their new cashback program. Through their cashback program, they hope to increase community engagement and help expose their PENGU ecosystem to potential new users.

The announcement of the cashback program placed increased attention on the price of PENGU, as traders watch for potential signs of greater buy-side interest after the announcement.

Your spending is more rewarding when you use the Pengu Card 🐧

Earn up to 3% cashback in USD on your everyday purchases.

Get your Pengu Card below 👇 pic.twitter.com/suH6XPgR78

— Pudgy Penguins (@pudgypenguins) May 18, 2026

Also Read: PENGU Price Analysis: Can Bulls Hold $0.0104 Support?

PENGU Price Nears $0.0092 Resistance

The TradingView chart shows PENGU trying to find stability after a major price jump earlier this month. The price has moved above many of the EMAs recently before entering a pullback phase. The 20 EMA at approximately $0.0092 is currently resistance; the 50 EMA at approximately $0.0087 is currently serving as support.

The 100 EMA also remains close to the current trading range, showing that the price is trying to consolidate at a very important technical level. The 200 EMA at approximately $0.0108 also is still acting as significant resistance on a longer timeframe.

The MACD indicator is indicating a loss of momentum with the MACD line crossing below the signal line and the red histogram becoming more significant in size. Despite weakening momentum, buyers continue defending the $0.0080 support zone.

PENGU price analysis
Source: TradingView

PENGU is still in recovery mode, with traders monitoring important support and resistance levels. The Cashback Card Launch has not only provided new excitement in the ecosystem, but technical indicators are also continuing to show the coin’s consolidation.

Other cryptocurrencies are experiencing extreme volatility, and thus, the PENGU price may continue seeing short-term volatility.

This article contains market analysis and price predictions. These are not guarantees. Crypto markets are volatile. Always DYOR. Not financial advice.

Also Read: PENGU Price Prediction: Can Bulls Push Toward $0.017 After a Pullback?

Filed Under: Cryptocurrency News, Meme Coins

BNB Price Targets $663 Breakout as BNBAgent SDK Boosts Sentiment

By Athulyamol VS | Edited By Ammar Raza,May 19, 2026, 1:30 AM

Following the launch of the BNBAgent SDK on the BNB Chain mainnet, BNB price has remained in focus within the cryptocurrency market.

BNB serves as the native cryptocurrency of the BNB Chain ecosystem and is widely used for payment of trading fees, use of decentralized applications, and network utility across multiple products associated with the Binance exchange. At press time, BNB was trading at around $644 with a decrease of nearly 0.8% over the past 24 hours.

Technical Indicators Support BNB Price’s Bullish Structure

As shown in the TradingView Trading Chart (below), BNB has formed a consolidation zone around the $644 support area while attempting to reclaim the $663 resistance level as the BNB price continues forming higher lows.

The BNB price structure suggests price movement continues to create consistently higher levels of support while also corresponding with continued interest by buyers through recent periods of significant volatility.

From a technical perspective, the MACD continues to trade above the zero line (green), indicating that the broader BNB price trend remains bullish, despite the histogram indicating decreasing strength of buying during the past few trading sessions. The RSI is currently trading in the neutral zone, indicating that the price of BNB is neither extremely overbought nor oversold based on current price levels.

Volume levels appear to have been relatively consistent during this time period, however the On-Balance Volume (OBV) continues to reflect that large institutional and retail investors have not exhibited any increased distribution pressure during this recent period of pullbacks in BNB price.

BNB price analysis
Source:TradingView

Also Read: Binance Coin Price Prediction: BNB Eyes Explosive 61% Surge in 2026

BNBAgent SDK Launch Strengthens BNB Price Sentiment

BNB Chain posted on X that the BNBAgent SDK is officially available on the mainnet. The BNBAgent SDK is intended to be used by software developers who want to create blockchain-based agents powered by artificial intelligence and with features supporting commerce, prove identity, and send and receive payments.

The launch of the BNBAgent SDK reflects BNB Chain’s increasing focus on building artificial intelligence-related infrastructure within the blockchain space. The addition of the SDK to the BNB ecosystem should provide additional infrastructure for AI-powered applications while supporting long-term ecosystem activity.

BNBAgent SDK is now live on BNB Chain mainnet.

It gives developers a modular standard for building AI agents with identity, commerce, payments and memory, as the core infrastructure needed for production-ready agentic applications on BNB Chain.

Here’s what builders need to know… pic.twitter.com/rCYMssjvPm

— BNB Chain (@BNBCHAIN) May 18, 2026

In addition, in keeping with the current price structure of BNB, ecosystem news of a positive nature usually tends to provide a certain degree of confidence in the market during periods of consolidation, which occur during the period prior to the breakout from a resistance zone.

BNB is trading in proximity to an important technical level, and traders are monitoring the $663 level of resistance very closely.

The launch of the BNBAgent SDK adds another positive development to the broader BNB ecosystem narrative. At the same time, cryptocurrency markets are very volatile, and short-term BNB price movements may remain highly sensitive based on the overall market conditions.

This article contains market analysis and price predictions. These are not guarantees. Crypto markets are volatile. Always DYOR. Not financial advice.

Also Read: BNB Price Breakout Could Open a Path to a Strong Rally Toward $1,376

Filed Under: Cryptocurrency News

XRP ETFs Record $60M Weekly Inflows, Highest in 2026

By Amrin Sanjay | Edited By Ammar Raza,May 19, 2026, 1:00 AM

XRP exchange-traded funds (ETFs) recorded their strongest weekly performance of 2026 after attracting more than $60 million in net inflows last week. The latest figures show rising institutional interest in XRP-linked investment products as all five XRP ETF products posted positive weekly flows. The inflow surge also helped ETFs recover earlier losses recorded this year and pushed cumulative net inflows to new highs.

XRP ETFs Post Strongest Weekly Inflows of the Year

Information shared by market watchers revealed that XRP ETFs experienced about $60.5 million worth of weekly net inflows in the second week of May 2026. This was the highest amount of weekly inflows so far in the year for the product. The good performance came after some weeks of consistent inflows to crypto products.

XRP ETFs post strongest weekly inflows of the year
Source: SoSoValue

All five XRP ETF products reportedly recorded positive flows during the week. Analysts noted that broad participation across all products indicates growing investor confidence rather than isolated buying activity in a single fund. The development also reflects increasing demand for regulated the altcoins investment exposure.

The current inflows were much greater than in previous weeks in 2026. Previous weekly inflow records were smaller, and even in April, there was moderate growth in institutional demand. This surge has placed May among the strongest months for the altcoins ETFs since inception.

Also Read: XRP Price Holds Strong Despite Market Pressure as $10 Rally Expectations Grow

May Inflows Surpass Earlier Monthly Totals

Based on the statistics, the amount of money that flowed in just last week, at $60 million, was more than the total amount recorded for the months of January, February, and March of the year 2026. There has been an accelerated inflow of money into its investment products in May.

Total monthly flows for May have already surpassed the record set by April at $81.59 million. There is an expectation that the monthly total will keep increasing if the positive flows keep coming in the coming weeks. Demand from ETFs has become a vital factor when it comes to institutional interest.

ETFs are becoming increasingly popular as an indicator of general market confidence. High capital flows in crypto ETFs often indicate that traders are looking for a regulated way to invest in digital currencies. The altcoin ETFs have started exhibiting similar patterns observed earlier in Bitcoin ETFs.

Cumulative XRP ETF Inflows Reach $1.39 Billion

The latest inflow surge pushed cumulative XRP ETF net inflows to approximately $1.39 billion. This means XRP ETFs have fully recovered losses recorded earlier in 2026. The milestone reflects continued investor interest despite volatility across the broader crypto market.

Total assets in the ETFs have also seen an increase after the latest surge in investments. The increase in assets under management indicates that the investors are staying put and not planning to exit from the market at a fast pace. This could point toward longer-term confidence among institutional participants.

Trading volumes across the altcoins ETF products also showed improvement during the week. Increased trading activity often accompanies periods of stronger investor demand and market participation. Analysts say sustained volume growth will be important for maintaining momentum in ETF inflows.

The performance of ETFs may also influence sentiment around the altcoins ecosystem more broadly. Strong ETF demand can improve market liquidity and attract additional institutional attention. This could support further expansion of the altcoin-related financial products in the future.

This article contains market analysis and price predictions. These are not guarantees. Crypto markets are volatile. Always DYOR. Not financial advice.

Also Read: XRP Price Breakout Above $1.56 Could Trigger Strong Upside Rally Move

Filed Under: Ripple (XRP), Altcoin News, Cryptocurrency News

  • « Go to Previous Page
  • Page 1
  • Interim pages omitted …
  • Page 8
  • Page 9
  • Page 10
  • Page 11
  • Page 12
  • Interim pages omitted …
  • Page 3615
  • Go to Next Page »

Primary Sidebar

Recent Posts

  • JASMY Price Breakout Above Weekly High Could Trigger Strong Rally to $0.27 May 22, 2026
  • Why RLUSD Stablecoin Cannot Replace XRP in Digital Asset Routing Explained May 21, 2026
  • Circle-Backed QCAD StableFX Enables Real-Time Institutional FX Settlement May 21, 2026
  • Avalanche Stablecoin Partnerships Fuel Growth as AVAX Eyes $13.52 Level May 21, 2026
  • IG Europe Expands Crypto Services With Bitpanda May 21, 2026

Footer

News

  • Latest News
  • Altcoin News
  • Bitcoin (BTC)
  • Blockchain
  • Tron (TRX)
  • World

Digest

  • Meet the Founder
  • Price Winning Article
  • DeFi
  • Cyber Security
  • Crypto Scam

Industry

  • Project Review
  • Technology
  • Fintech
  • Tron Exchange
  • New in Town

Tron Universe

  • Event and Tron Parties
  • New in Town
  • Tron Tokens

FOLLOW US

  • Facebook
  • Telegram
  • Twitter
  • Linkedin

Editorial Policy | Privacy Policy | Disclaimer | Terms and Conditions | Masthead

Copyright © 2026 · Tron Weekly. All Rights Reserved. NOTE: Tron Weekly is an independent crypto news site that adheres to the strict journalism policy anchored on transparency, trust, and objectivity, we have no affiliation with the TRON Foundation, its founder Justin Sun or any other cryptocurrency firm.