• Skip to primary navigation
  • Skip to main content
  • Skip to primary sidebar
  • Skip to footer
  • About TronWeekly
  • Write for us
  • Terms and Conditions
  • Privacy Policy
  • Disclaimer
  • Contact
  • All Posts
  • Advertise

TronWeekly

Crypto World News

  • Home
  • Latest News
  • Opinion
    • Education
    • Best TRON Wallets
    • Beginner’s guide to TRON
    • Tron Tokens
    • Market Analysis
  • Industry
    • Tron Exchange
    • Project Review
  • Press Release
  • Bitcoin (BTC)
  • Ripple (XRP)
  • Advertise
  • About TronWeekly
    • The Team
    • Editorial Policy
    • Write for us
    • Privacy Policy
    • Disclaimer
    • Terms and Conditions
    • Contact
You are here: Home / All Posts

All Posts

Polymarket Launches Prediction Markets for IPOs and Private Valuations

By Arslan Tabish | Edited By Ammar Raza,May 19, 2026, 8:30 PM

Prediction markets platform Polymarket launched new contracts tied to private company milestones. The products cover IPO timing, valuation targets, earnings, and secondary market activity. The company said resolution data will come only from Nasdaq Private Market through a new partnership.

The prediction markets launch gives users event-based access to major private firms. It does not provide equity ownership or shares. Polymarket said the category will focus on verifiable outcomes linked to private market activity.

Also Read: Nvidia Hits $5.4 Trillion Market Cap as Jensen Huang Joins Trump on China Trip

Prediction Markets Open Access to Private Firm Events

According to the report, CEO Shayne Coplan said prediction markets can widen access to financial information and opportunity. He said the new products bring visibility to a part of finance that retail users have rarely been able to access.

Coplan said users can engage with outcomes that drive value at major private companies. Those outcomes include valuation milestones, IPO timing, and secondary-market activity. The platform described the contracts as a transparent way to follow private company events.

Some of the first contracts visible on Polymarket are OpenAI, Anthropic, Stripe, Databricks, and Kraken. These markets query whether selected firms will trade at specified value points on specific dates.

Source: Polymarket

Hyperliquid-based TradeXYZ launched pre-IPO perpetual futures, but Polymarket takes a different approach. This included products associated with Cerebras, as well as SpaceX, the company owned by Elon Musk. Its mission is to convert private market sentiment into real, on-chain tradable markets.

Nasdaq Data Backs Polymarket Contracts

Polymarket, on the other hand, is event contracts of a milestone-based nature. Instead, it relies on prediction markets that settle on outcomes rather than ownership rights. This keeps the products away from direct investment exposure to private companies.

Nasdaq Private Market will be the source of the data used to verify the new contracts. Polymarket CEO Tom Callahan noted that the platform they have built has the power to unlock greater access. Any data, he said, will make accurate resolutions in the market.

In addition, prediction markets may also provide institutional investors with options, the company said. These contracts might serve as a near-real-time signal for sentiment and pricing of private company shares. Signals like these may be important before firms reach the public markets.

In addition, the prediction markets category expands Polymarket’s base of contracts. New market launches reached record monthly highs in every month over the past year. Polymarket says it has processed roughly $39 billion of U.S. activity in 2026.

Also Read: Revolut Launches Dogecoin Debit Card: Strong Target of 100K Daily Crypto Payments
Filed Under: Cryptocurrency News

Bitcoin Price Faces Pullback Toward $74K Amid Weakening Momentum

By Mishal Ali | Edited By Ammar Raza,May 19, 2026, 8:00 PM

Bitcoin is moving in a downward direction after rejecting key resistance, confirming a corrective phase as momentum weakens and RSI declines. The Bitcoin price may retest lower support due to liquidity pressure, while stronger resistance above keeps the market trapped in a tight consolidation range with increased volatility.

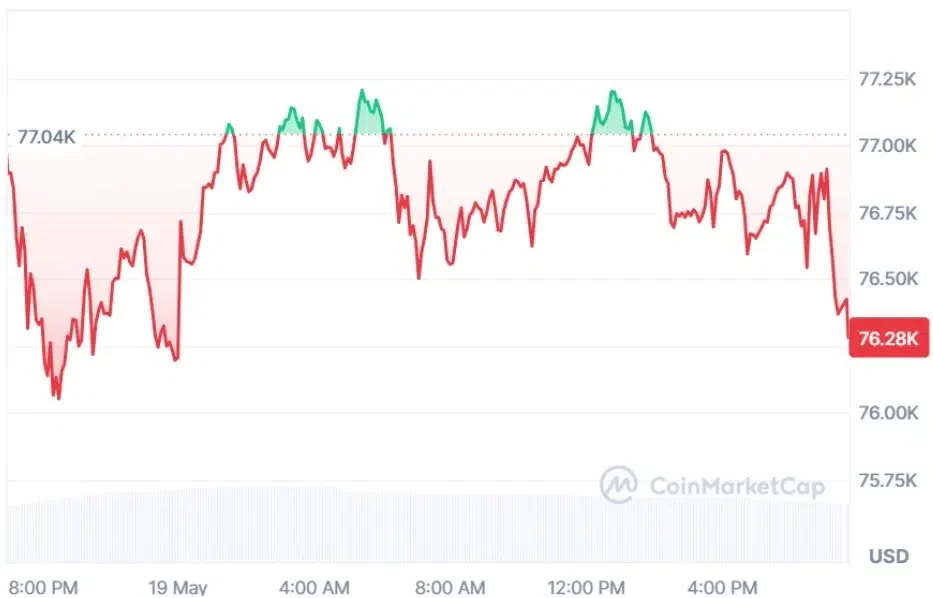
At the time of writing, BTC is trading at $76,428.80 with a 24-hour trading volume of $33.77 billion and a market capitalization of $1.53 trillion. Despite the signs of stability over the last 24 hours, Bitcoin is facing a crucial test of whether it maintains its current position or leads to deep pullbacks.

Bitcoin current price

Source: CoinMarketCap

Bitcoin Faces Pullback Toward $74K After Rejection

However, the crypto analyst Titan of Crypto revealed that the Bitcoin price has failed to sustain momentum above the weekly Kijun, with price action rejecting this key Ichimoku resistance zone. 

The move signals strong selling pressure as the Kumo cloud also turns away the lagging span, reinforcing bearish sentiment. Overall structure suggests the market remains in a corrective rather than breakout phase for now across timeframes.

Bitcoin price prediction

Source: Titan of Crypto’s X Post

Market focus now shifts toward the Tenkan level near $74,000, where a retest is increasingly likely following rejection from higher resistance.

This zone may act as a short-term equilibrium and liquidity reset before any renewed attempt to reclaim the Kijun and reestablish bullish momentum in upcoming sessions if buying pressure returns across the broader market structure.

Also Read: Bitcoin Falls From $82K to $76K Amid Weak ETF Demand

Technical Indicators Reinforce Weakening Momentum

According to TradingView, the Bitcoin price is in a bearish trend at the macro level, which is transitioning to a spring trend after hitting its bottom at $60,000 in February 2026. 

The Bitcoin price is currently at $76,304. The price movement remains glued to the significant EMAs. BTC is above the 50 EMA but faces strong resistance at the 200 EMA of $81,765.

Bitcoin price analysis

Source: TradingView

Short-term momentum is losing steam as the Bitcoin price retreats from the recent high within the local range. 

RSI has dropped to 42.87, falling below the 57.15 signal level and pointing to a rising sell-off. The weakening momentum is supported by the recent red candlestick formation below the $78,540 EMA support level.

BTC Faces Liquidity Bands Between $75K and $82K

Moreover, the data from another crypto analyst further highlighted that the liquidity pools of Bitcoin have established short-term price levels that will make the difference. From the downside, there is a lot of liquidity at $74.8K and $75.5K. 

In case the Bitcoin price retraces to these levels, then the long trades might be forced to liquidate. They act as temporary centers of attraction, leading to fast price movement and volatility.

BTC price liquidation levels

Source: Daan Crypto Traders’ X Post

In positive terms, however, the liquidity bands pile up between $78K and $80K, thereby creating a strong support band following the recent steady fall. 

In case of a resurgence in momentum, yet another bunch around $82K appears to be the next level of focus. Such an arrangement creates a well-defined trading range for the Bitcoin price action.

This article contains market analysis and price predictions. These are not guarantees. Crypto markets are volatile. Always DYOR. Not financial advice.

Also Read: Swan Bitcoin Sued for Nearly $1B in Prime Trust Bankruptcy Case

Filed Under: Cryptocurrency News, Bitcoin (BTC)

XRP Price Coils for Breakout as Tight Consolidation Signals Move to $1.80

By Mishal Ali | Edited By Ammar Raza,May 19, 2026, 7:00 PM

XRP price is moving in a narrow consolidation range, signaling a potential sharp breakout. A move above resistance could trigger upside, while the loss of support risks a decline. Despite market weakness, XRP saw small ETF inflows while Bitcoin and Ethereum faced outflows.

At the time of writing, XRP is trading at $1.37 with a 24-hour trading volume of $1.83 billion and a market capitalization of $85.01 billion. Despite the signs of stability over the last 24 hours, XRP’s movement in a narrow range and positive ETF flow point to a trend reversal.

XRP current price

Source: CoinMarketCap

Also Read: XRP ETFs Record $60M Weekly Inflows, Highest in 2026

XRP Price Coils for Breakout Toward $1.50

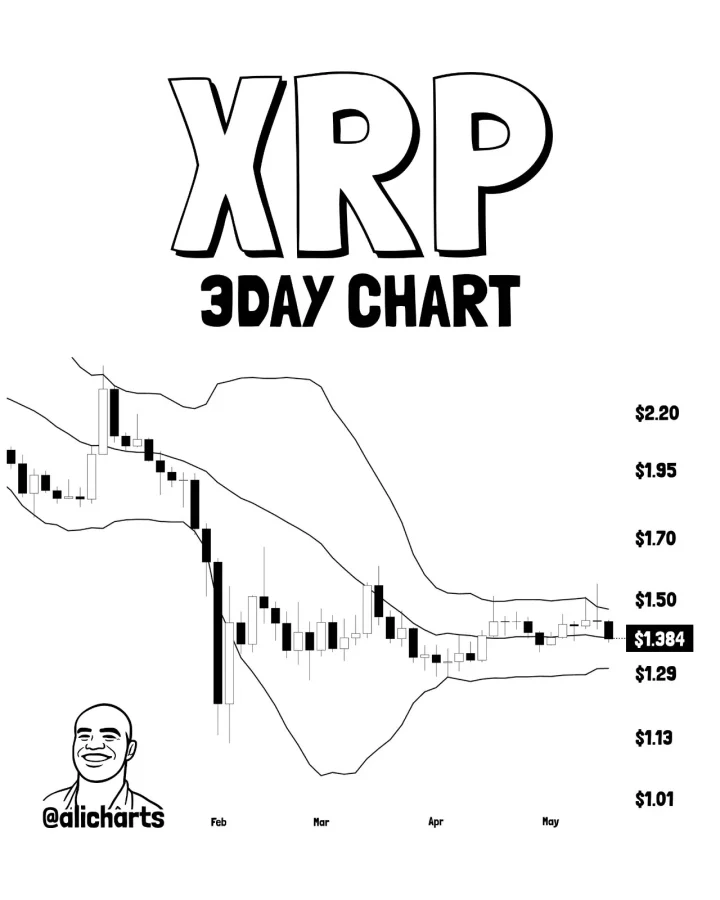
According to the crypto analyst Ali Charts, the XRP price is approaching a major technical inflection point as its 3-day chart shows one of the tightest Bollinger Band squeezes in over a year. 

Market volatility has compressed significantly, suggesting an imminent expansion phase. Traders are watching closely as the XRP price coils within a defined consolidation range, awaiting a decisive breakout signal to emerge soon.

The XRP price action is squeezed inside a tight channel oscillating between $1.29 and $1.50. The neutrality of the compression makes the trend direction ambiguous. 

A clear breakdown of the resistance level on three consecutive days will create opportunities for a bullish breakout towards $1.80. On the other hand, falling below support will weaken the present scenario and favor bearish moves, aiming at $1.

XRP price prediction

Source: Ali Charts’ X Post

However, the current situation with the Bollinger Bands shows that there is a very tight squeeze of volatility, which means that a strong move in the XRP price may happen at any time. 

However, it still remains a non-trading territory until a certain signal confirms that the breakout actually happened. One should wait until the candle closes in three days to confirm the breakout for the XRP price.

XRP Defies Crypto Crash With Positive ETF Inflows

The data from BankXRP further highlighted that while the rest of the crypto ETFs’ day is largely red, XRP managed to make an uncommonly positive flow divergence. 

The Bitcoin ETFs declined by around $648 million, while Ethereum lost close to $86 million. XRP, on the other hand, attracted around $750K worth of inflows.

XRP ETF inflows

Source: BankXRP’s X Post

ETF flows usually act as a market mood ring, and thus, this divergence in flow becomes very conspicuous. 

The weakness of BTC and ETH suggests that there is a risk-off sentiment in the market, but the inflows into XRP indicate that there may be some selective buying. Even though the figures are small, this difference is making traders watch the charts closely.

This article contains market analysis and price predictions. These are not guarantees. Crypto markets are volatile. Always DYOR. Not financial advice.

Also Read: XRP Price Analysis: Will a Breakout Above $1.50 Trigger a Rally?

Filed Under: Cryptocurrency News, Ripple (XRP)

ATS Price Setup Hints at Massive Upside Potential Toward $1.82 Target

By Mishal Ali | Edited By Ammar Raza,May 19, 2026, 6:30 PM

Alltoscan (ATS) price surged after breaking out of a multi-year triangle pattern with strong volume, signaling a potential trend reversal. Technical indicators show accelerating bullish momentum for the ATS price, with traders targeting higher price levels as buyers continue driving the rally.

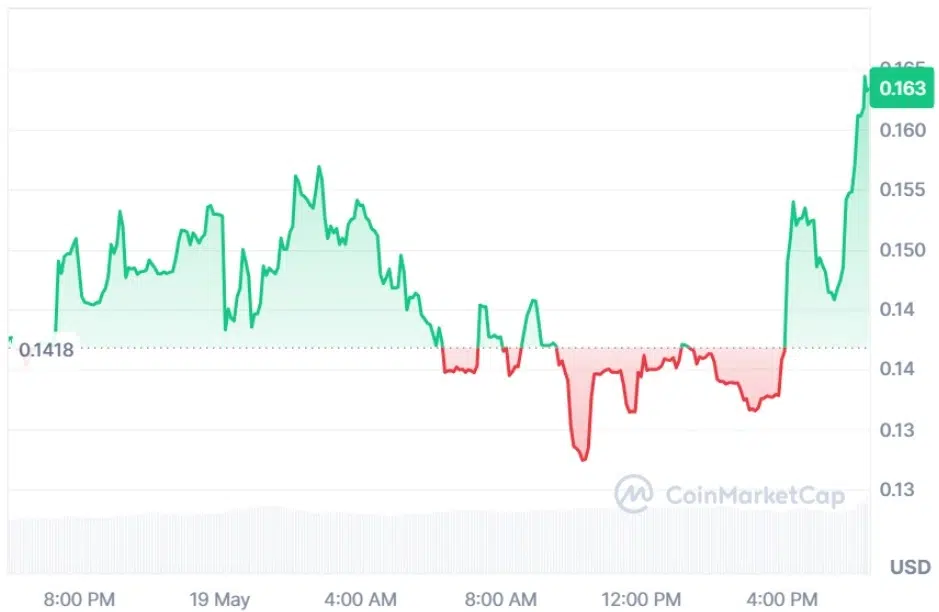
At the time of writing, ATS is trading at $0.05510 with a 24-hour trading volume of $414.12 million and a market capitalization of $12.2 million. After posting a 16.26% gain over the last 24 hours, everyone’s attention is on the question of whether the token could maintain its momentum or face a short-term pullback.

ATS current price

Source: CoinMarketCap

Also Read: Solana Price Faces Key Rejection at $98 as Downtrend Pressure Builds

ATS Price Surges After Multi-Year Triangle Breakout

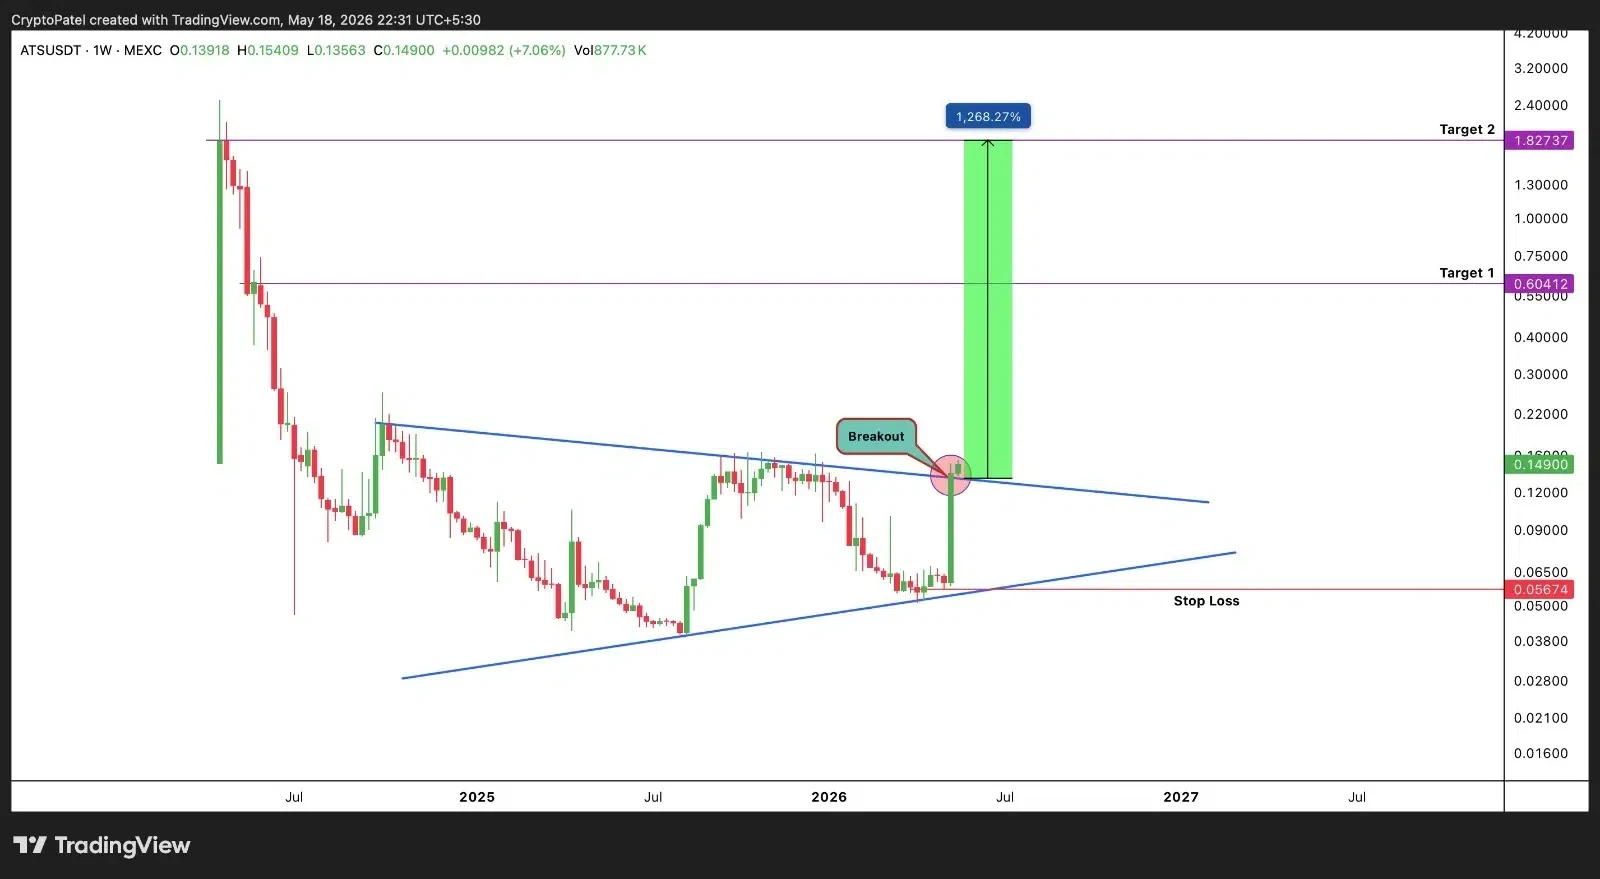
Furthermore, the crypto analyst Crypto Patel highlighted that the ATS price has captured traders’ attention after breaking out of a massive multi-year triangle pattern with powerful trading volume, signaling a potential trend reversal. 

The breakout comes after months of consolidation, with analysts calling it one of the strongest technical setups in the altcoin market. Buyers are now stepping in aggressively as momentum rapidly accelerates.

ATS price prediction

Source: Crypto Patel’s X Post

The market observers have been looking out for a first swing towards $0.60, with further bullish strength indicating a potential upside move for the ATS price as high as $1.82. 

The price level of $0.056 is particularly important from the perspective of risk management, with continued momentum expected to lead to a more extensive rally.

Technical Indicators Point to a Strong Breakout

According to TradingView, the ATS price marks a dramatic change in trend: from an extended period of markdown to an explosive and momentum-filled breakout. 

In early 2026, the ATS price fell below the thick Ichimoku cloud and moved downwards continuously until it found itself in a confined accumulation range of $0.06500. The consolidation phase is marked by a compression of the Bollinger Bands.

ATS technical analysis

Source: TradingView

The ATS price experienced a violent spike in mid-May, going almost vertically up towards $0.14637, breaking through the resistance cloud overhead. 

This caused the bands to widen because of the price moving close to the upper band, which is at $0.15058. The move was fueled by the sharp vertical move of the lagging Chikou Span indicator.

This article contains market analysis and price predictions. These are not guarantees. Crypto markets are volatile. Always DYOR. Not financial advice.

Also Read: SUI Price Nears Critical Support, Eyes Possible Rally Toward $1.42

Filed Under: Cryptocurrency News, Altcoin News

BNB Chain Unleashes Binance x402 as AI Spending Nears $2.5T in 2026

By Athulyamol VS | Edited By Ammar Raza,May 19, 2026, 6:00 PM

BNB Chain Following the launch of Binance x402, an advanced payment solution to support AI, APIs, and digital services available on BNB Chain, there has been increased interest in the BNB price.

This reflects the overall development of Binance’s focus on the AI-powered digital economy. At press time, BNB price was trading at $637.94, up 0.26% over the past 24 hours.

BNB Chain Gains Attention Amid $2.52T AI Market Growth

BNB  Chain and Binance x402 integration
Source: Binance

According to the recent post on X by BNB Chain, unlike traditional checkout systems, the new Binance x402 framework simplifies APIs, data platforms, and AI agent payments via automated usage-based billing with decreased integration complexity on BNB Chain.

As Binance Research has reported, global spending on Artificial Intelligence is projected to rise 44% from 2025 to $2.52 trillion by 2026. Due to this rapidly expanding marketplace, there is growing interest in blockchain networks that can support machine-to-machine transactions on their networks.

The Binance x402 framework supports off-chain authorisation and on-chain settlement by allowing merchants to avoid developing their own systems for validating payments. The framework will also support stablecoins including USDT and USDC on BNB Chain.

Introducing #Binance x402

HTTP-native programmable payments on @BNBCHAIN

Built for agent-driven and software-native commerce:
👉 Standard HTTP 402 payment flows
👉 Off-chain authorization + on-chain settlement
👉 Pay-per-call and usage-based billing
👉 Autonomous transactions… pic.twitter.com/DKm0ebMrAQ

— Binance (@binance) May 19, 2026

Also Read: BNB Price Targets $663 Breakout as BNBAgent SDK Boosts Sentiment

BNB Price Utility Expands With HTTP-Native Payments

According to the official Binance blog, in addition to providing support for HTTP-native payments, Binance x402 will create an integrated payment option for users via Trust Wallet AgentKit, which allows for self-custody AI agent payments while maintaining users’ private keys on their devices.

As a result of these advancements, BNB Chain has strengthened its position in the rapidly developing autonomous payment industry.

The BNB price will likely experience a positive shift in sentiment as Binance continues to expand into AI-based commerce by providing additional programmable payment systems, stablecoin applications, and agent-driven transaction options for businesses on BNB.

These developments will also support further growth in the digital economy as it evolves into an increasingly productive and technologically driven ecosystem.

Also Read: BNB ETF Nears Launch After Strong Filing of Amended S-1 prospectuses with SEC

Filed Under: Binance Coin (BNB), Cryptocurrency News

Hyperliquid Whale Gains $12.9M After 6-Month HYPE Long

By Amrin Sanjay | Edited By Ammar Raza,May 19, 2026, 5:30 PM

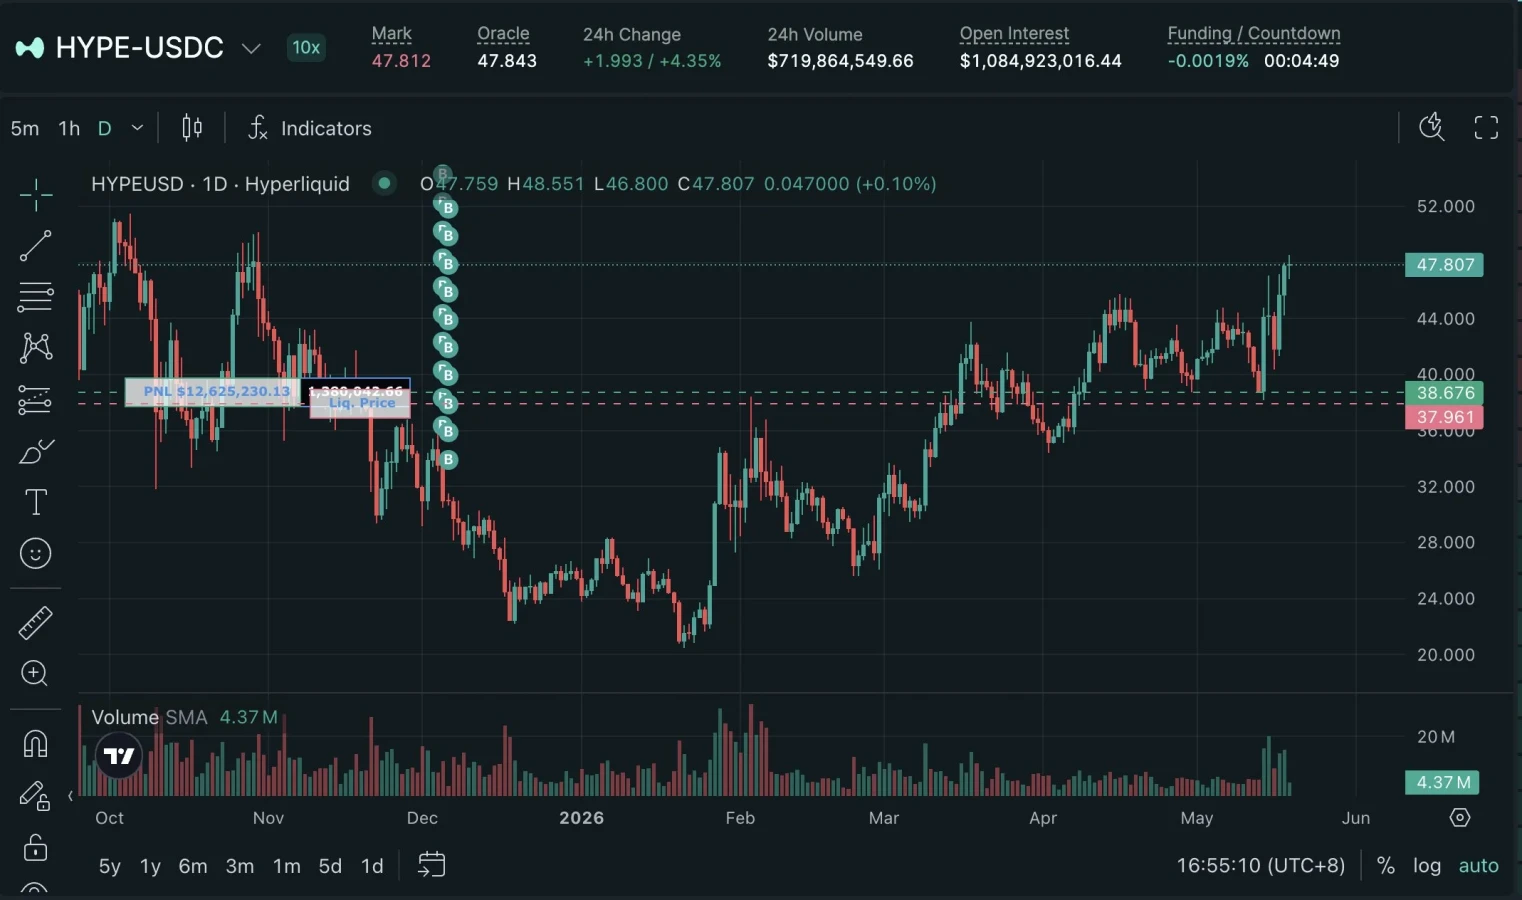
A large Hyperliquid trader has returned to profit after holding a leveraged HYPE position through months of market volatility. According to on-chain data shared by Lookonchain, the trader’s 1.38 million HYPE long position, once down more than $25 million, is now showing an unrealized profit of approximately $12.9 million following the recent rally in the token.

Persistence pays off!

More than 6 months ago, trader 0x082e opened a 5x long on 1.38M $HYPE ($66.3M), becoming the largest on-chain $HYPE bull.

As $HYPE fell, he was once down over $25M.

But after $HYPE rallied, he has turned the position around and is now sitting on an… pic.twitter.com/xRQvDGwejN

— Lookonchain (@lookonchain) May 19, 2026

Trader Held 1.38 Million HYPE Through Market Decline

According to the trader, the trade is more than six months old and involved opening a long position for 1.38 million HYPE tokens at a 5x leverage. The value of the trade when executed amounted to roughly $66.3 million. The trade can be considered one of the biggest on-chain bullish trades ever placed on the token.

Trader held 1.38 million Hyperliquid through market decline
Source: Lookonchain

As the broader crypto market weakened in the following months, HYPE also experienced heavy price declines. The trader’s position eventually recorded an unrealized loss of more than $25 million during the downturn. Despite the steep drawdown, the position remained open, signaling strong conviction in the long-term outlook of the asset.

Also Read: Hyperliquid (HYPE) Price Eyes $100 Target Amid Strong Bullish Momentum

HYPE Recovery Pushes Position Back Into Profit

The recent rebound in HYPE prices significantly improved the trader’s position. On-chain tracking data now shows the long position sitting on an unrealized profit of around $12.9 million. The recovery highlights the sharp volatility often associated with leveraged crypto trading.

Market participants observed that the reversal was brought about by an increased interest in Hyperliquid and its ecosystem token. There were also more transactions in other altcoins in the market, which boosted the performance of HYPE. The positive movement was able to wipe out losses incurred previously.

Leveraged Trading Continues to Draw Attention

Large leveraged positions often become closely watched by traders because they can influence market sentiment and liquidity. In crypto markets, whale positions are frequently monitored for potential liquidation risks and directional signals. The Hyperliquid trade became especially notable because of the trader’s decision to maintain exposure during prolonged losses.

However, the use of leverage creates both opportunities for controlling bigger positions with a relatively small amount of capital and risks of losses in case of an adverse price movement. In our example, the trader was able to avoid liquidation despite the significant changes in prices during the period of several months.

Hyperliquid Gains Visibility in Derivatives Market

Hyperliquid has gained increasing attention within the decentralized derivatives sector over the past year. The platform has attracted users through high trading activity, perpetual futures products, and growing liquidity across its ecosystem. HYPE has also become one of the more actively discussed tokens among on-chain traders.

Whale trades have become indicative of the increasing prominence of decentralized exchanges in the cryptocurrency space. Whale trades are no longer a secret and traders can easily keep track of their movements. As the decentralized derivatives market grows, similar transactions might affect the perception of new cryptocurrencies.

This article contains market analysis and price predictions. These are not guarantees. Crypto markets are volatile. Always DYOR. Not financial advice.

Also Read: Hyperliquid (HYPE) Adds $2 Billion Market Cap in 24 Hours

Filed Under: Altcoin News, Cryptocurrency News

Solana Becomes No. 2 RWA Chain With $2.8B Value

By Amrin Sanjay | Edited By Ammar Raza,May 19, 2026, 5:00 PM

Solana has emerged as the second-largest blockchain for real-world assets (RWAs), with the total value of tokenized assets on the network crossing $2.8 billion. The milestone reflects growing institutional and developer interest in using Solana for tokenized financial products beyond its earlier reputation as a memecoin-focused ecosystem.

Solana quietly became the second largest RWA chain and most of crypto Twitter still thinks it's just for memecoins… pic.twitter.com/tIzbLhaKo3

— Rand Group (@randgroup) May 19, 2026

Solana’s RWA Market Value Crosses $2.8 Billion

According to data released by the crypto research platform Rand Group, the value of tokenized real-world assets in Solana has seen a sharp increase from late 2024 through to May 2026.

The value of the RWA in the SOL network is said to have risen from below $400 million at the beginning of 2025 to just above $2.85 billion in May 2026. This growth has positioned Solana as the second-largest blockchain in the RWA sector.

Solana’s RWA market value crosses $2.8 Billion
Source: Rand Group

The rise highlights increasing adoption of blockchain-based financial assets such as tokenized treasuries, private credit products, and other traditional financial instruments. SOL’s low transaction costs and high-speed infrastructure are often cited as reasons behind the network’s expanding role in the RWA market. Analysts believe the sector could continue growing as more institutions explore blockchain-based settlement systems.

Also Read: Solana Price Faces Key Rejection at $98 as Downtrend Pressure Builds

RWA Sector Expands Beyond Ethereum Dominance

Traditionally, Ethereum has been at the forefront of the tokenized assets market, being home to most RWA-based projects. Yet, with the emergence of new platforms such as SOL, which can process transactions faster while also reducing the cost of operations, it is evident that more players are emerging within the industry.

The growth of RWAs on SOL also reflects broader changes within the crypto industry. Investors and developers are increasingly focusing on utility-driven sectors instead of purely speculative trends. As tokenized assets gain traction, networks capable of handling large transaction volumes efficiently may attract additional capital and partnerships.

Institutional Interest Supports Solana Growth

The increase in tokenized assets on SOL comes as institutional interest in blockchain infrastructure continues to expand globally. Financial firms are experimenting with tokenized securities, bonds, and treasury products to improve settlement efficiency and reduce operational costs. SOL’s infrastructure has made it a candidate for handling these applications at scale.

There are also several market experts who have observed that RWAs are one of the fastest growing segments of the digital asset market space. As opposed to memecoins or speculative trading instruments, RWAs are directly associated with traditional financial assets. Such an association adds strength to the use case for the segment.

Solana Moves Beyond Memecoin Narrative

Solana has often been linked to memecoin trades in past market cycles. But according to new RWA data, the platform seems to be moving away from memecoins to more general use cases in finance. The development of tokenized assets could provide a boost to SOL’s crypto ecosystem.

The industry players see RWA as one of the major themes that can define the crypto cycle to come. If adoption is sustained, SOL will have cemented its position as not just another blockchain for retail use but a significant one for finance infrastructure as well. Future developments will depend on several factors.

Also Read: Solana Price Faces Crucial Retest as Breakout Momentum Targets $120 and $145

Filed Under: Solana (SOL), Altcoin News, Cryptocurrency News

Ethereum Staking Hits 31% of Supply as ETH Falls 26%

By Amrin Sanjay | Edited By Ammar Raza,May 19, 2026, 4:30 PM

Ethereum’s staking ratio has climbed to nearly 31% of the total ETH supply despite the cryptocurrency declining 26% year-to-date. The growing percentage of staked ETH highlights continued confidence among long-term holders and validators, even as market prices remain under pressure. Recent blockchain data also suggests that staking participation continues to increase steadily across the Ethereum network.

ETH is down 26% YTD.

Yet Ethereum’s staking ratio is now approaching a new all-time high.

31% of the entire ETH supply is locked in staking. pic.twitter.com/oF3zqffndd

— Leon Waidmann (@LeonWaidmann) May 19, 2026

Ethereum Staking Reaches New High Levels

The number of people participating in staking on the Ethereum blockchain has been increasing over the course of 2026, as more individuals have been locking their ETH in validators. As per data from blockchain monitoring websites, the percentage of ETH that is currently staked is about 31%. This marks one of the highest staking ratios recorded since Ethereum transitioned to proof-of-stake.

The increase in staking comes despite ETH experiencing a significant price decline this year. Ethereum has fallen roughly 26% on a year-to-date basis as broader crypto market volatility affected major digital assets. Even with weaker prices, investors appear willing to hold and stake ETH for long-term rewards.

Ethereum staking reaches new high levels
Source: ValidatorQueu.com

The practice of staking ensures that ETH owners can earn money from holding their tokens passively while securing the ETH network. The validators are involved by locking up their ETH and validating transactions within the blockchain. Increased participation in staking shows positive expectations about future growth.

Also Read: Ethereum Foundation Faces Growing Wave of Leadership Resignations

ETH Price Weakness Contrasts With Network Activity

Ethereum’s market performance in 2026 has remained weaker compared to previous bullish cycles. The cryptocurrency faced selling pressure amid broader macroeconomic concerns and declining speculative activity in crypto markets. Reduced investor appetite for risk assets also contributed to ETH’s decline.

The decline in prices does not affect the performance of Ethereum in some other fields. The decentralized finance protocols, staking solutions, and layer two scalability networks still actively operate on the ETH network. Moreover, developers still try to increase the scalability and efficiency of ETH.

It is believed that the increased staking ratio can lower the supply of tokens in the market. As more tokens become locked in staking smart contracts, there will be less coins left for the trading process.

Validator Participation Continues Expanding

The Ethereum proof-of-stake mechanism uses validators to guarantee security and validate transactions. The number of active validators has been increasing consistently since the introduction of the system due to the increased number of people joining the staking system.

Staking platforms and liquid staking mechanisms have also played a part in the increase in staked ether. Staking is made easier through such platforms since the stakers do not need to run their own validator nodes. Thus, small investors can also earn staking rewards.

Validator queue data showed sustained interest in joining ETH’s staking system over recent months. Even during periods of price declines, staking demand remained elevated. Analysts believe this demonstrates confidence in ETH’s role as a leading smart contract blockchain.

Long-Term Outlook for Ethereum Remains Mixed

While staking growth remains strong, ETH still faces challenges in the broader market environment. Competition from alternative blockchains and concerns over transaction fees continue to affect investor sentiment. Market uncertainty has also limited aggressive buying activity in recent months.

Meanwhile, Ethereum still reigns supreme in some significant industries in the crypto space. This blockchain continues to be the biggest platform for decentralized finance and tokenization. Future improvements and developments in the network can further solidify its standing.

The future trajectory of ETH’s price, according to analysts, can depend on both macroeconomic factors and adoption trends. Further increases in staking would make the supply better in case of eventual recovery of demand. Meanwhile, volatility will remain one of the most important aspects for traders.

Also Read: Bitmine Expands Ethereum Treasury to 5.28M ETH With 71,672 ETH Buy

Filed Under: Ethereum (ETH), Altcoin News, Cryptocurrency News

Bitcoin Price Holds Strong Above $75K Despite Consecutive ETF Outflows

By Athulyamol VS | Edited By Ammar Raza,May 19, 2026, 4:00 PM

Bitcoin price has been struggling this week due to the continued decline in price and negative market sentiment, which has brought the value of Bitcoin down to a major support area near $75,000.

Currently, the largest cryptocurrency in terms of market capitalization, Bitcoin, continues to be seen as one of the major indicators in the overall digital assets space. Historically, Bitcoin has received a lot of institutional interest as a result of spot ETFs, derivatives, and an increasing number of users both globally and domestically.

At press time, Bitcoin price was trading at around $76,796, recording a decrease of nearly 6% over the past 24 hours following recent market volatility.

ETF Outflow Pressure on Bitcoin Price

According to SoSoValue, the U.S. Bitcoin spot ETFs recorded a net outflow of $648.64M on May 18; this was one of the largest days for Bitcoin ETF withdrawals in recent weeks. The consecutive outflows on May 13 and May 15 also show that there is a decrease in institutional demand for the ETF.

Additionally, large funds from BlackRock, Fidelity, and ARK have drastically withdrawn funds from their respective ETFs after the recent large drop in the BITCOIN price from above $80,000 earlier this month.

ETF Outflow Pressure on Bitcoin Price
Source: SoSoValue

Also Read: Echo Protocol Exploit Freezes $73.2M in Fake eBTC

Bitcoin Keeps Trading Strong Amid Major Market Correction

The TradingView chart shows that BTC has continued to consolidate near the 50-day moving average and 200 DMA after recovery from the earlier correction phase. The key resistance level is found near $81,000, while BTC has immediate support from $75,800–$76,000.

Recent candlestick formations show sideways movement while BTC traders are still waiting to see if the Bitcoin can hold and maintain support levels near the current price. If there is a continued move lower from this area, then there could be further downside potential for BTC toward the mid-$74K region.

Bitcoin Keeps Trading Strong Amid Major Market Correction
Source: TradingView

The recent increase in institutional selling pressure has caused some uncertainty around whether the Bitcoin price can continue holding above the major technical support level.

Market participants are now closely monitoring ETF flows and whether BTC will be able to recapture momentum to break above the $81,000 resistance area again in the coming days.

This article contains market analysis and price predictions. These are not guarantees. Crypto markets are volatile. Always DYOR. Not financial advice.

Also Read: Capital B Acquires 192 BTC for $15.2M, Expands Bitcoin Treasury to 3,135 BTC

Filed Under: Cryptocurrency News, Bitcoin (BTC)

Polkadot (DOT) Price Forecast: Bulls Aim for $1.40 After Recent Pullback

By Tina Fatima | Edited By Ammar Raza,May 19, 2026, 3:30 PM

Polkadot (DOT) price remains bearish after rejection from key resistance, with price staying below the Ichimoku cloud. Momentum indicators show weakening strength and seller control. Market focus is on holding support levels to avoid further downside, while ecosystem growth continues through the Acurast upgrade on Polkadot.

DOT Price Faces Strong Bearish Pressure

According to the TradingView chart, Polkadot (DOT) price remains bearish below Ichimoku resistance. DOT Price is trading near $1.234 after rejection from the $1.40–$1.42 resistance.

Immediate support sits at $1.22; losing it may trigger drops toward $1.20 and the Bollinger lower band near $1.17. Recovery requires reclaiming $1.29–$1.31 resistance and moving back above the cloud.

Bollinger Bands show volatility expansion after a sharp rejection from the upper band around $1.408. Current structure favors sellers as the DOT price stays below Tenkan at $1.326 and Kijun near $1.309.

DOT price prediction chart
Source: TradingView

Short-term bounce is possible from $1.22–$1.23 support, but trend reversal remains unconfirmed unless buyers reclaim $1.33.

The Ichimoku cloud flipped bearish, signaling weakening momentum for DOT/USD. Consecutive red candles and failed rebounds confirm seller control.

If bulls defend $1.22 support and break above $1.31, upside targets become $1.33, then $1.40. However, a breakdown below $1.22 could accelerate declines toward $1.17 and potentially lower levels afterward.

Also Read: Polkadot (DOT) Below EMAs: Can It Break $2.35 Resistance Level?

Momentum Indicators Confirm Weakness

From an indicator perspective, the RSI is suggesting that Polkadot is losing steam from the daily time frame.

As the RSI indicator has been hovering around 41.66 levels, it is evident that the bears have the upper hand below the 50-level mark. Earlier bullish divergence was not able to support the price and pushed it lower.

DOT TradingView chart
Source: TradingView

A bearish crossover is indicated by the MACD, as the histogram shifts towards the red side and momentum weakens.

While the signal line initially remains above the MACD line, downward pressure increases, driving the negative value close to -0.010.

This suggests that the current downtrend will persist while bullish momentum fades following the latest reversal below resistance.

Polkadot Ecosystem Expands With Acurast

The latest update of Acurast’s Cargo is now live on the Polkadot mainnet. With this, the decentralized cloud network continues to extend its capabilities, allowing the deployment of full Linux containers that run on Android devices in over 175 countries.

For builders, Acurast Cargo offers developers cloud-like environments that are familiar to them for running any workload, equipped with deployment, logging, debugging, and shipping functionalities by leveraging Polkadot as the decentralized infrastructure for scaling global computing applications.

This article contains market analysis and price predictions. These are not guarantees. Crypto markets are volatile. Always DYOR. Not financial advice.

Also Read: Polkadot (DOT) Down 98% From $55 ATH, Eyes $1 Zone

Filed Under: Altcoin News

  • « Go to Previous Page
  • Page 1
  • Interim pages omitted …
  • Page 6
  • Page 7
  • Page 8
  • Page 9
  • Page 10
  • Interim pages omitted …
  • Page 3615
  • Go to Next Page »

Primary Sidebar

Recent Posts

  • JASMY Price Breakout Above Weekly High Could Trigger Strong Rally to $0.27 May 22, 2026
  • Why RLUSD Stablecoin Cannot Replace XRP in Digital Asset Routing Explained May 21, 2026
  • Circle-Backed QCAD StableFX Enables Real-Time Institutional FX Settlement May 21, 2026
  • Avalanche Stablecoin Partnerships Fuel Growth as AVAX Eyes $13.52 Level May 21, 2026
  • IG Europe Expands Crypto Services With Bitpanda May 21, 2026

Footer

News

  • Latest News
  • Altcoin News
  • Bitcoin (BTC)
  • Blockchain
  • Tron (TRX)
  • World

Digest

  • Meet the Founder
  • Price Winning Article
  • DeFi
  • Cyber Security
  • Crypto Scam

Industry

  • Project Review
  • Technology
  • Fintech
  • Tron Exchange
  • New in Town

Tron Universe

  • Event and Tron Parties
  • New in Town
  • Tron Tokens

FOLLOW US

  • Facebook
  • Telegram
  • Twitter
  • Linkedin

Editorial Policy | Privacy Policy | Disclaimer | Terms and Conditions | Masthead

Copyright © 2026 · Tron Weekly. All Rights Reserved. NOTE: Tron Weekly is an independent crypto news site that adheres to the strict journalism policy anchored on transparency, trust, and objectivity, we have no affiliation with the TRON Foundation, its founder Justin Sun or any other cryptocurrency firm.