Arbitrum (ARB) holds key support within a descending channel as buyers attempt to stabilize the ARB price after a long downtrend. Momentum shows early recovery signals, though confirmation is still needed for a stronger bullish move. Meanwhile, Coinbase’s x402 on Arbitrum advances automated AI-driven crypto payments.
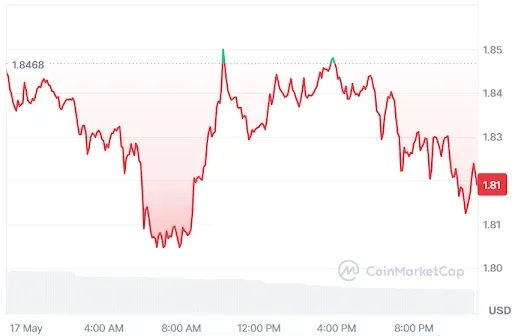
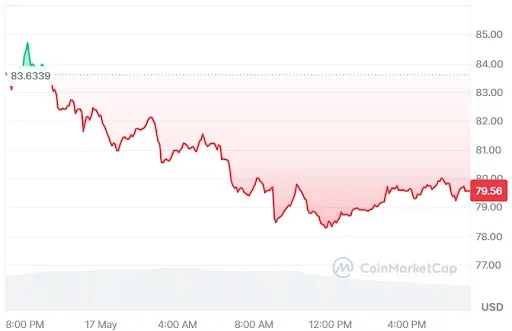
At the time of writing, ARB is trading at $0.1191 with a 24-hour trading volume of $53.29 million and a market capitalization of $732.72 million. Despite the neutral price outlook, analysts are expecting a move above the upper boundary of the wedge pattern, which could pave the way to a strong trend reversal.
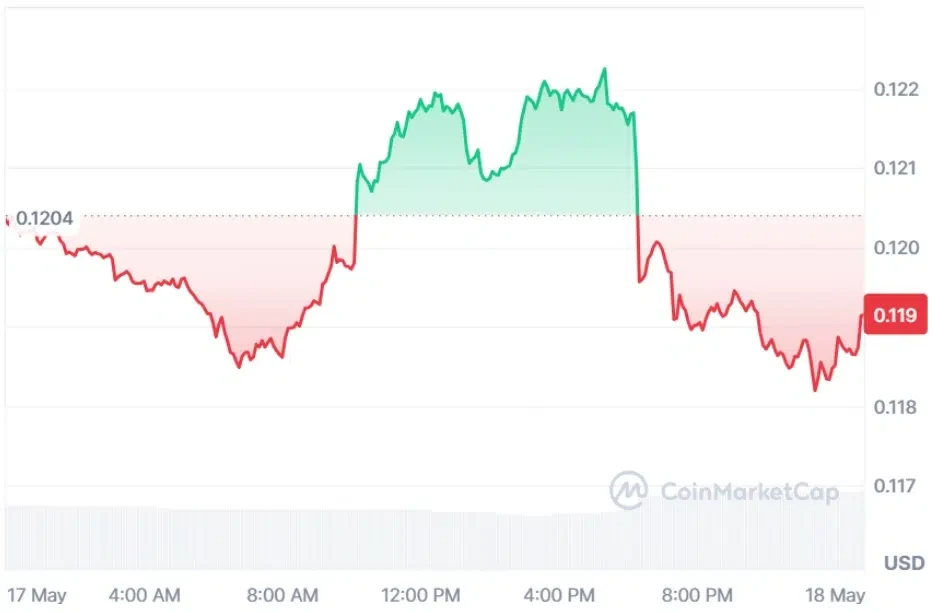
Source: CoinMarketCap
ARB Price Holds Key Support as Bullish Setup Forms
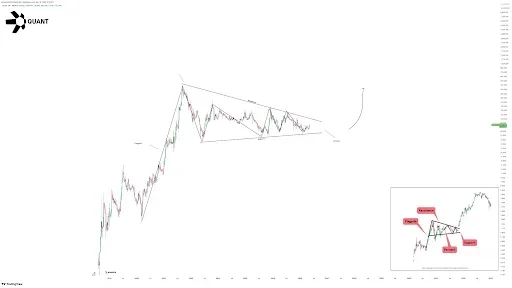
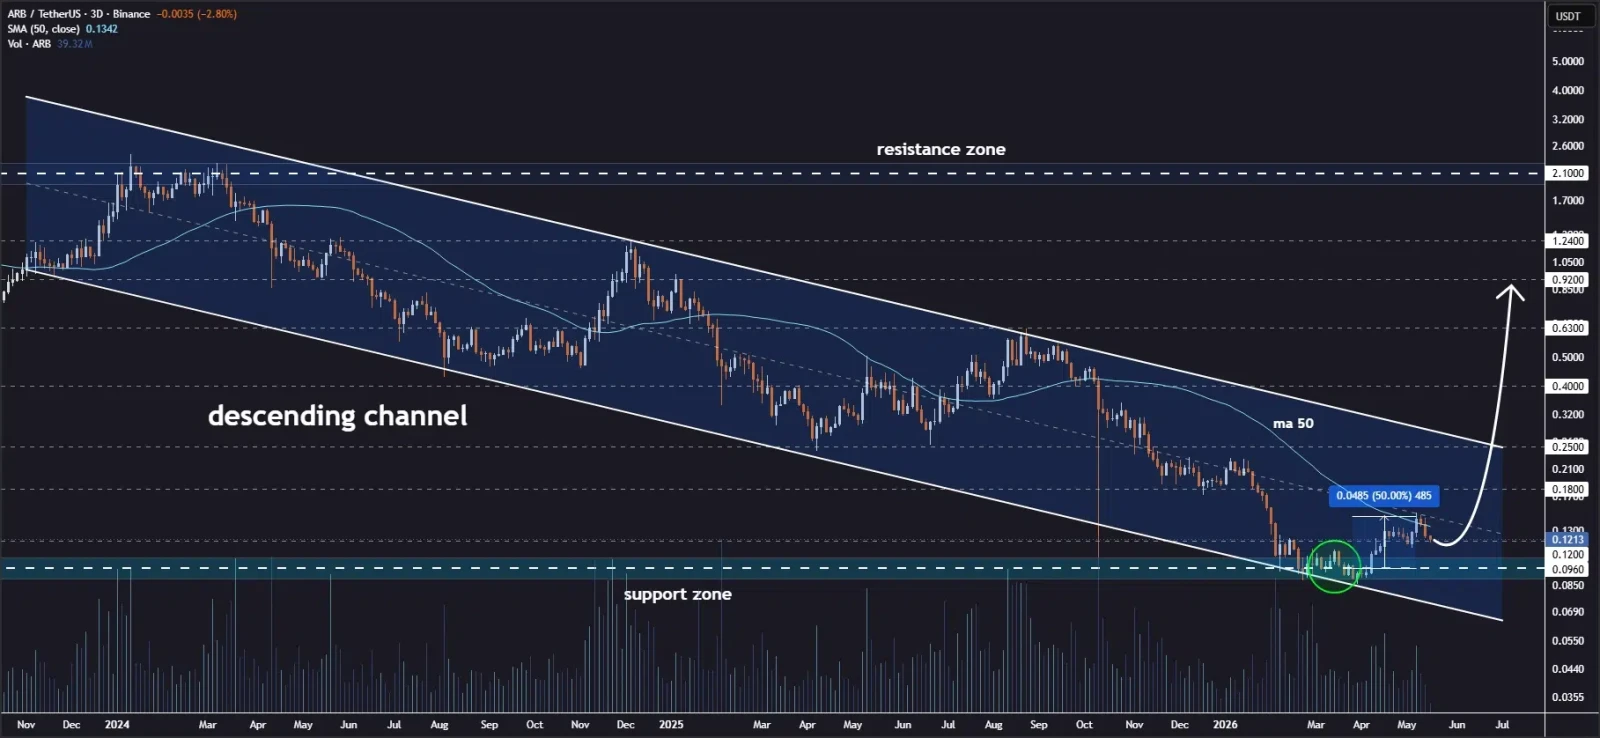
Furthermore, the crypto analyst Jonathan Carter highlighted that the ARB price is currently holding above the lower boundary of a descending 3-day channel, indicating that buyers are defending a key support zone despite ongoing bearish structure.
The ARB price has already reacted from this area, with partial profits taken near the channel midline, where resistance typically emerges and slows upward momentum.
Source: Jonathan Carter’s X Post
In the event that support is maintained, then the configuration would be indicative of an opportunity for another run in the existing trend direction for the ARB price.
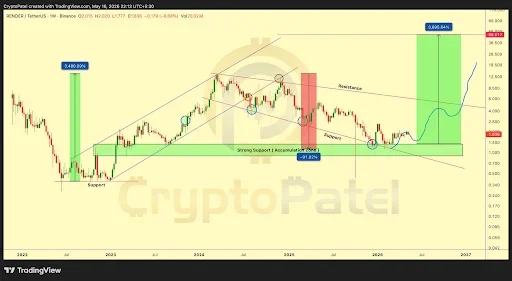
Some upside resistances that traders should watch out for include $0.18, $0.25, $0.40, $0.63, and $0.92. However, for such a positive momentum to be confirmed, more buying interest is required.
Also Read: Arbitrum $71M ETH Plan Faces Court Block After DAO Approval
Technical Indicators Point to Fading Bullish Strength
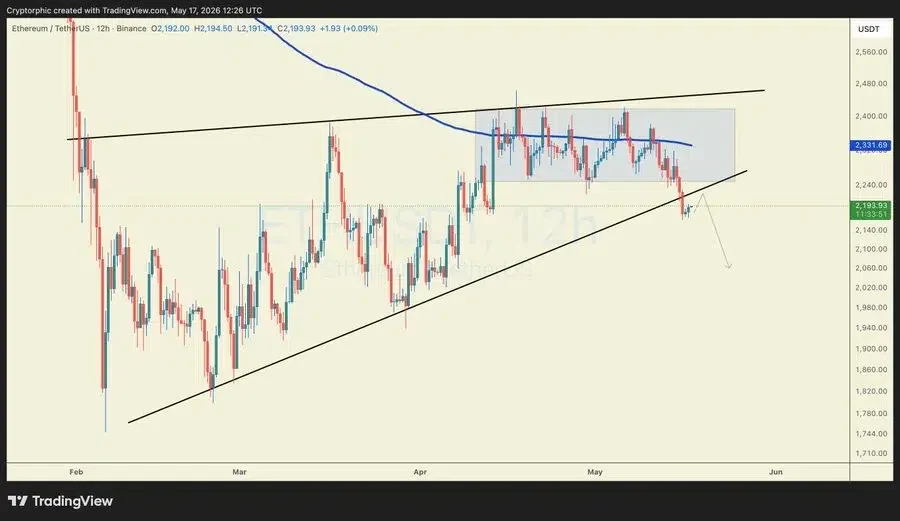
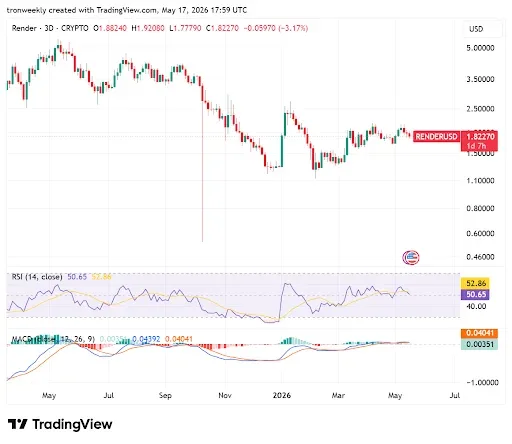
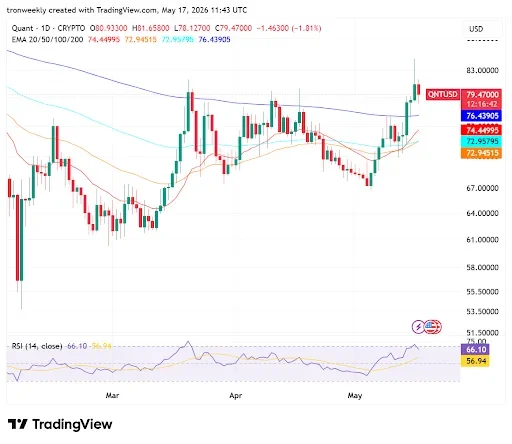
According to TradingView, there have been evident downtrends of ARB’s macros starting from early 2024, declining from the price above $1.50 to below $0.07, breaking through important support levels.
Currently, there is a mild recovery rally taking the ARB price up to $0.1185. There seems to be an emerging trend of higher lows, marked by consecutive green weekly candles.

Source: TradingView
Technical signals show signs of emerging divergence from an oversold level. The RSI is rising to 39.59, piercing above the signal line since selling is reducing for the ARB price.
Similarly, the MACD makes a bullish divergence with a green bar at 0.01275. The trend indicates that bearish momentum has stopped, and buyers have come back into the picture.
Arbitrum Powers Coinbase’s x402 Agentic Payment System
The data from Arbitrum further highlighted that agentic commerce represents an emerging foundation for the programmable economy in which AI agents can carry out transactions on their own without any input from humans.
One such example is Coinbase’s x402, which is currently active on Arbitrum and enables AI agents to buy access to APIs, services, and software using stablecoins.

Source: Arbitrum’s X Post
x402 operates on the scalable Layer-2 platform provided by Arbitrum, providing cheap and fast micro-transactions to drive machine-based economies.
Artificial intelligence will be able to purchase data, computing power, or access to applications automatically, ushering the internet into an era of code-run economies. This is a huge step forward towards autonomous economies.
This article contains market analysis and price predictions. These are not guarantees. Crypto markets are volatile. Always DYOR. Not financial advice.
Also Read: Arbitrum Price Outlook: Support Retest Could Drice Next Move Toward $0.16