• Skip to primary navigation
  • Skip to main content
  • Skip to primary sidebar
  • Skip to footer
  • About TronWeekly
  • Write for us
  • Terms and Conditions
  • Privacy Policy
  • Disclaimer
  • Contact
  • All Posts
  • Advertise

TronWeekly

Crypto World News

  • Home
  • Latest News
  • Opinion
    • Education
    • Best TRON Wallets
    • Beginner’s guide to TRON
    • Tron Tokens
    • Market Analysis
  • Industry
    • Tron Exchange
    • Project Review
  • Press Release
  • Bitcoin (BTC)
  • Ripple (XRP)
  • Advertise
  • About TronWeekly
    • The Team
    • Editorial Policy
    • Write for us
    • Privacy Policy
    • Disclaimer
    • Terms and Conditions
    • Contact
You are here: Home / All Posts

All Posts

SUI Price Prediction: $1.44 Resistance Levels in Focus After Correction

By Tina Fatima | Edited By Ammar Raza,May 17, 2026, 9:01 PM

Sui price continued holding a key support zone despite recent weakness, keeping the broader bullish outlook active. Technical indicators showed slowing momentum after the rally, though buyers still maintain partial control. Meanwhile, optimism around the Clarity Act and institutional adoption strengthened overall sentiment surrounding the SUI ecosystem.

SUI Price Holds Critical Fibonacci Support Zone

According to the crypto analyst MCO Global, the SUI price is trading near a major Fibonacci retracement zone after facing rejection from its recent rally peak.

Price currently holds around the $1.02 support region, which remains critical for maintaining bullish momentum. Buyers defending this area could help stabilize sentiment and support another attempt at an upward continuation ahead.

The Elliott Wave structure on the chart suggests the recent decline may represent a corrective phase before another expansion move develops.

SUI price prediction chart
Source: @moretradingonl

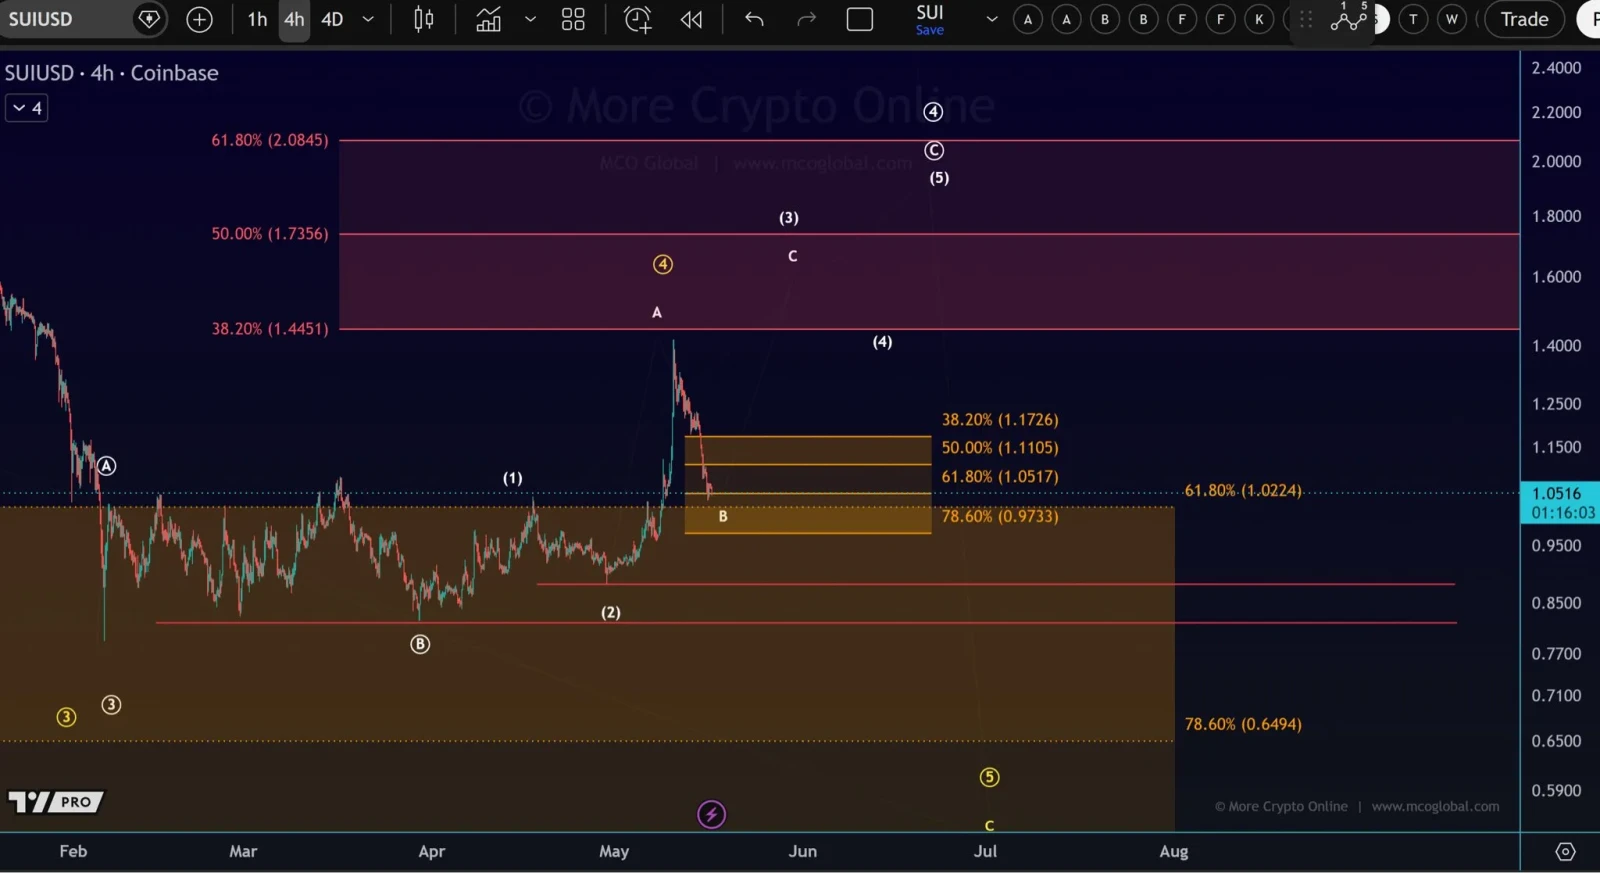
If bullish momentum returns, resistance levels near $1.17 and $1.44 may become immediate upside targets. Stronger continuation could later expose the higher projected extension zones above.

On the downside, losing support around the current retracement cluster may trigger additional weakness toward lower Fibonacci levels near $0.97 and $0.85.

A deeper breakdown could invalidate the short-term bullish setup entirely. Overall, the broader structure still favors recovery while higher support levels remain protected by bulls.

Also Read: SUI Price Breaks Descending Channel as Momentum Builds Toward $4.20

Momentum Indicators Show Bullish Weakness Emerging

From an Indicators perspective, the RSI (14) is at approximately 51.75, with an RSI Moving Average of 62.99, suggesting that the upward momentum is weakening despite a prior overbought move.

While prices decline, RSI is above the critical level of 50, indicating that buyers have not fully lost control over SUI price action.

SUI tradingview chart
Source: TradingView

MACD Signal strength is waning since MACD lies very close to the level 0.05112, while signal lines are slightly lower at the 0.05374 level.

The histogram is in negative territory and at levels of -0.00262, suggesting that momentum is weakening somewhat. However, MACD is still positive, which means that the overall trend is bullish.

Clarity Act Boosts Institutional SUI Sentiment

SUI price sentiment received fresh support after the co-founder of Sui Network, Eman Abio, emphasized the role the Clarity Act could play in transforming crypto institutional adoption.

The new regulatory framework will bring about more clarity in the regulations, thus incentivizing large financial institutions to move operations on-chain, which is expected to bring more long-term investments to the SUI ecosystem.

This will enhance the optimism for the digital asset. Market adoption, trades, and sentiments can be boosted because of such trends. Now, traders are keenly waiting for confirmation on whether SUI can continue to hold above significant support lines.

This article contains market analysis and price predictions. These are not guarantees. Crypto markets are volatile. Always DYOR. Not financial advice.

Also Read: SUI Price Breakout Holds: Bulls Eye $4.20 Target After Pullback Signal

Filed Under: Altcoin News

Litecoin Price Forms Rounding Top: Will $56.25 Support Hold?

By Yahya Raza Sherazi | Edited By Messam Raza,May 17, 2026, 7:00 PM

Litecoin price remained under pressure on Sunday, May 17, as buyers failed to build stronger momentum. Analysts pointed to weakening short-term structure, lower market participation, and a possible breakdown setup if sellers gain control near the base zone.

As of writing, Litecoin (LTC) is trading at $56.34, marking an increase of 0.75% in a day. The trading volume is down by 38.86% and is currently standing at $189.68 million. Over the last week, the LTC coin price has declined by 3.48%, according to CoinMarketCap.

Source: CoinMarketCap

Also Read: Dogecoin Price Signals Major Breakout Potential as DOGE Targets $0.15

Litecoin Price Faces Breakdown Risk Near Neckline

Analyst Alpha Crypto Signal highlighted that LTC is forming a rounding top pattern after failing to stay above local highs. The analyst pointed out that the token is converging towards the support level, and the moving averages of the short time frame have less bullish control on the chart.

The same outlook placed focus on the base of the structure. A clean break below that neckline area, with volume confirmation, could activate the rounding top setup and allow further downside continuation if sellers take control near key support levels.

Source: X

Moreover, another analyst, CryptoWZRD, revealed that LTC is barely bearish on the daily chart, but the intraday chart remains in a range. The analyst noted that a break below $56.25 could signal weakness, but a move above could extend a range in the market for the time being.

Source: X

Futures Volume Falls as Open Interest Slips

According to CoinGlass data, the future volume dipped by 46.97% to $204.41 million, whereas open interest decreased by 0.90% to $354.77 million. The OI-weighted funding rate was 0.0019%, indicating low market confidence among leveraged traders.

Source: CoinGlass

Litecoin Price Stays Below Key EMA Levels

TradingView data shows that the Litecoin price is currently trading around $56.36 on the daily chart. The 20-day EMA was at $56.89, with the 50-day EMA at $56.38 and LTC just below both short-term EMAs and within a tight resistance zone.

Longer-term EMA levels were still above the prevailing prices. The 100-day EMA is at $58.82, while the 200-day EMA is at $67.05, indicating resistance in the price of Litecoin before the price can make a broader recovery on the daily time frame.

Source: TradingView

The Relative Strength Index (RSI) charts also showed a period of less momentum in the recent pullback. The 14-day RSI stood at 48.64, while the RSI moving average was 56.95, placing the indicator below its signal line and away from the upper zone in daily momentum data.

This article contains market analysis and price predictions. These are not guarantees. Crypto markets are volatile. Always DYOR. Not financial advice.

Also Read: Zcash Price Breaks Above $513 as Bullish Structure Signals Continued Upside

Filed Under: Cryptocurrency News, Litecoin (LTC)

Bitcoin Price Rejected at $80,000 as Technical Indicators Flash Warning Signs

By Bena Ilyas | Edited By Ammar Raza,May 17, 2026, 5:00 PM

Bitcoin price seems to be exhibiting some early indications of losing its upward momentum in the wake of its most recent gains. The current trends suggest that there are now higher levels of profits being taken out, which is preventing further growth. Overall, all eyes will now be on how the Bitcoin price holds up in the coming trading periods.

At the time of writing, BTC is trading at $78,451, with a 24-hour trading volume of $23.18 billion and a total market capitalization of $1.57 trillion. The BTC price has recorded a slight gain of 0.82% over the last 24 hours, but overall movement remains uneven as the market struggles to build stronger upward momentum.

BTC price chart
Source: CoinMarketCap

Also Read |Ethereum Price Prediction Shows Over 110% Upside Toward $4,800 Breakout Zone

Bitcoin Price Risks Correction Ahead

On May 17, 2026, a popular crypto analyst, Ali Martinez, cautioned that the Bitcoin market could be in an overheated state. According to him, the mean realized profit margins have risen to about 17%, indicating that a considerable number of players in the market are holding profitable positions. Previously, such levels were followed by increased selling pressure as people tried to book their gains, thus restraining any rise in the BTC price.

Bitcoin profit cycle chart
Source: Ali Martinez’s X Post

He further emphasized the importance of an important parallel from the past. It was the last time that the achieved profit margin touched such levels while the Bitcoin price was also under pressure amid resistance around its 200-day moving average back in March 2022. Such a scenario ultimately ended in a local top and then a downward correction.

BTC Price Loses Key Momentum

Technically, it appears that the Bitcoin price is losing momentum following a failure to remain above the mark of $80,000. The RSI  indicator fell to 48.95, which is below its average of 60.53. This indicates that sellers have gained the upper hand. Currently, the BTC price stands at $78,451, while there is strong resistance at the 200-day moving average at $81,598.

BTC technical analysis chart
Source: TradingView

Furthermore, the MACD line currently holds at 946.07, and the histogram is down at -521.02, indicating increased negative pressure. Should the sell-off continue, the Bitcoin price may head for critical support zones like $75,434 and $72,146.

Overall, the Bitcoin price is currently in a delicate phase where factors such as technical analysis and profit-taking are contributing to its direction. Even though the current support lines are not broken, the future move will be dependent on whether new buying power emerges or if selling pressure increases.

This article contains market analysis and price predictions. These are not guarantees. Crypto markets are volatile. Always DYOR. Not financial advice.

Also Read | FARTCOIN Price Analysis: Failed Breakout And Weak Support Raise Downside Risks

Filed Under: Cryptocurrency News, Bitcoin (BTC)

WIF Price Forecast: Falling Wedge Pattern Could Trigger a Bullish Move to $1.30

By Mishal Ali | Edited By Messam Raza,May 17, 2026, 4:00 PM

Dogwifhat (WIF) shows potential for a bullish rally following the weeks in consolidation in a falling wedge pattern. However, technical indicators signal weakening momentum for the WIF price with bearish shifts in trend strength.

Derivatives data reflects mixed participation, with slightly rising open interest but declining trading activity, suggesting cautious market engagement. According to CoinMarketCap, WIF is trading at $0.1972 with a daily decline of 1.36%.

WIF current price

Source: CoinMarketCap

WIF Derivative Data Point to Mixed Outlook

According to Coinglass, the WIF open interest increased by 1.20%, reaching $85.27 million, indicating a slight rise in active contracts and trader participation, suggesting improving market engagement and potentially stronger positioning or renewed confidence in derivatives markets despite short-term fluctuations and ongoing volatility in trading conditions.

WIF open interest and volume

Source: Coiglass

However, volume declined by 25.97%, reaching $67.83 million, reflecting reduced trading activity and weaker participation compared to prior levels, possibly driven by lower volatility, cautious sentiment, or a temporary market slowdown in derivatives trading conditions.

Also Read: Dogwifhat (WIF) Nears Key Support: Is a $1.35 Reversal Coming?

WIF Price Setup Hints at a Bullish Move Toward $1.30

Furthermore, the crypto analyst Jonathan Carter pointed out that WIF has formed a falling wedge in its 2-day chart, a formation known to be a sign of weakening sellers and a potential bullish trend change. 

The WIF price has been compressing as it consolidates for several weeks, and the trading volume starts rising, indicating increasing trader participation. Traders will wait for a breakout from above the resistance trendlines in coming sessions.

WIF price prediction

Source: Jonathan Carter’s X Post

Experts are now looking for a breakout trigger that would help breach the resistance level of the wedge pattern, thus paving the path for a rally. If the momentum increases, the potential targets for the WIF price will be around $0.27, $0.36, $0.48, $0.70, and $1.30. 

However, there is a possibility that the trend may become invalid due to a sudden failure in sustaining the support level and market sentiment.

WIF Technical Indicators Point to Downward Pressure

According to TradingView, the WIF price has made a double bottom pattern between March and April, causing a strong bullish trend up to around 0.26000 by early May. 

From that time, the WIF price has moved into a correction, and several bearish candles have caused a downward movement of the price to around 0.19700.

WIF technical outlook

Source: TradingView

The technical indicators have proved that there is an immediate change in the momentum of the market.

This is evident by the fact that the RSI has dropped to 45.07 and has crossed its moving average, indicating that there is selling pressure in the market. At the same time, the MACD indicator has shown a bearish crossover.

This article contains market analysis and price predictions. These are not guarantees. Crypto markets are volatile. Always DYOR. Not financial advice.

Also Read: Dogwifhat (WIF) Shows Strength After Downtrend; Bulls Target $1.35 Level

Filed Under: Cryptocurrency News, Altcoin News

JASMY Price Analysis: Breakdown Below Key Levels Signals Downside Risk

By Mishal Ali | Edited By Messam Raza,May 17, 2026, 2:00 PM

JasmyCoin (JASMY) price action turned bearish after a failed breakout and rejection from key Fibonacci levels, falling back below the 20-day SMA. Technical indicators like MACD and Bollinger Bands confirm strong downside momentum for the JASMY price, while declining open interest and trading volume reflect reduced participation and weakening market sentiment. According to CoinMarketCap, JASMY is trading at $0.005907 with a daily decline of 2.31%.

JASMY current price

Source: CoinMarketCap

JASMY Derivative Data Reveal Bearish Pressure

According to Coinglass, the JASMY open interest decreased by 20.02%, falling to $20.65 million, indicating reduced derivatives positioning and declining speculative exposure in the market. This suggests traders are becoming more cautious, with fewer active contracts and weakening sentiment across the market.

JASMY open interest and volume

Source: Coinglass

Trading volume declined by 12.39%, reaching $20.75 million, reflecting reduced market activity and lower participation levels. This suggests weakening momentum among traders and decreased engagement in the market compared to prior periods, indicating a slowdown in trading interest.

Also Read: JASMY Price Targets $0.0099 After an Explosive Breakout Above $0.006

JASMY Price Slides Below Critical Fib Zones

Furthermore, the data from The JASMY Empire suggests that the JASMY price starts losing power after an extensive Fibonacci retracement from its peak at $0.01 towards cycle lows. 

The failure of the 0.5 level at $0.00736 is immediately followed by rejection beneath the 0.382 level at $0.00668. If the JASMY price move continues lower, attention turns towards the 0.236 level at $0.00585 for the next probable area of reaction.

JASMY price prediction

Source: The JASMY Empire’s X Post

The extended outlook is still bearish for the JASMY price, as the market has barely hit the 13-week mark of its present trend downward. Further declines may well be expected, especially if the price fails to convincingly break above the 0.5 Fibonacci retracement level. 

Breaking above this level may reverse the momentum, which might indicate the beginning of a reversal pattern currently taking shape.

Technical Indicators Point to Increasing Selling Pressure

According to TradingView, the JASMY price remained calm for two months while ranging in a tight range from $0.0051 to $0.0060, after which it entered into May with an impressive break higher, hitting its peak at $0.0079. 

However, the advance became overstretched above the Bollinger Bands, thus triggering a quick reversal back down, breaking below the 20-day SMA to test a new support around $0.00591.

JASMY price analysis

Source: TradingView

The momentum oscillator is giving a strong indication of this current bearish trend. There is a significant increase in the Bollinger Bands at the rally, but there is a pullback to the bottom of the bands at $0.00501. 

In addition, the MACD indicator has crossed below the signal line while the histogram is negative, which also points to a downward movement for the JASMY price.

This article contains market analysis and price predictions. These are not guarantees. Crypto markets are volatile. Always DYOR. Not financial advice.

Also Read: JASMY Price Prediction: Bullish Structure Points to a Rally Toward $0.0099

Filed Under: Cryptocurrency News, Altcoin News

SBI, Rakuten and Nomura Prepare Crypto Investment Trusts in Japan

By Yahya Raza Sherazi | Edited By Ammar Raza,May 17, 2026, 1:41 PM

Japan’s major brokerages are preparing crypto investment trusts for retail investors as regulators move toward clearer rules. SBI Securities and Rakuten Securities are developing products, while Nomura and other firms plan to enter once the regulatory framework is later finalized.

According to a Nikkei report, SBI Securities intends to sell funds established by SBI Global Asset Management. The products will be ETFs and investment trusts focused on liquid assets such as Bitcoin and Ethereum. The SBI intends to handle both development and distribution internally.

Also Read: Japanese Yen Stablecoin Planned for Ethereum and Japan Open Chain

Crypto Investment Trusts Could Widen Retail Access

Rakuten Securities is working with Rakuten Investment Management on a similar route. The planned crypto investment trusts would be available through smartphone trading apps. Investors could use securities accounts instead of crypto exchanges or wallets.

This change could open up opportunities to regular investors in Japan. To purchase digital assets now requires separate platforms and custody steps. Investors could buy exposure in crypto investment trusts, which would place it inside brokerage channels and remove one hurdle for retail clients.

Other major financial groups are preparing their plans. According to a Nikkei report, Nomura and Daiwa have started working on crypto investment trusts at the group level. SMBC Group and its securities firm, SMBC Nikko Securities Inc., are preparing for a cross-group task force to review options.

Asset Management One, which also belongs to Mizuho Financial Group, has conducted some initial preparations as well. The activity demonstrates brokers hoarding ahead of rule changes. Nonetheless, product launches are conditional on the last step in the regulation process.

Japan FSA Moves Toward Clearer Crypto Trust Rules

The Financial Services Agency of Japan is filing a revision or amendment to the enforcement order of the Investment Trust Act by 2028. 

The amendment would add cryptocurrencies to the list of assets that investment trusts are permitted to hold. Last month, Japan reclassified crypto-assets as financial instruments.

The change put crypto in the same general framework as stocks and bonds. Should the legislation pass in the current parliamentary session, it’s planned to begin in fiscal 2027. Japan is also seeking to put in place rules that would allow crypto ETFs by as early as 2028.

SBI Holdings had proposed a Bitcoin-XRP dual ETF and also a gold-crypto ETF, waiting to be approved. These represent a wider effort to prepare the way for crypto investment trusts in Japan.

Also Read: Harvard Endowment Exits Ethereum ETF, Reduces IBIT Holdings by 43%

Filed Under: Cryptocurrency News

Litecoin Price Prediction: Can LTC Surge 543% After Recent Pullback?

By Mishal Ali | Edited By Messam Raza,May 17, 2026, 1:00 PM

Litecoin (LTC) pulled back after failing to sustain its breakout attempt, while technical indicators showed weakening momentum and persistent bearish pressure for the Litecoin price. Meanwhile, declining open interest and trading volume reflected cautious trader sentiment and reduced market participation amid ongoing volatility. According to CoinMarketCap, LTC is trading at $56.22 with a daily decline of 1.09%.

Litecoin current price

Source: CoinMarketCap

LTC Derivative Data Point to Declining Strength

According to Coinglass, the LTC open interest fell by 3.24%, reaching $355.05 million and reflecting a moderate reduction in outstanding derivative contracts. The decline may signal profit-taking, reduced speculative activity, or cautious sentiment among participants. Traders appear less willing to maintain leveraged positions amid volatility.

Litecoin open interest and volume

Source: Coinglass

Trading volume declined by 21.05%, settling at $274.22 million. The drop suggests reduced market participation and weaker short-term momentum among investors. Lower activity levels often indicate caution, uncertainty, or temporary consolidation as traders reassess positions.

Also Read: Litecoin Price Analysis: LTC Price Action Shows Signs of a Strong Rally Toward $285

Litecoin Price Eyes Major Breakout With $388 in Focus

Furthermore, the crypto analyst Javon Marks highlighted that the Litecoin price seems to be preparing for an extended base that could last in the future, an environment that is often compared to Litecoin’s exciting breakout move in 2021. After being stuck in sideways price action for some time, traders feel that the Litecoin price is building up momentum under persistent resistance levels.

Litecoin price prediction

Source: Javon Marks’ X Post

The bulls now have a target of $388 in play, which is an indication that there is more than 543% room for growth in terms of profit from current prices. 

This growing confidence in Litecoin comes against the backdrop of increased investment interest in already established altcoins due to positive developments in the crypto world.

Technical Indicators Support Bearish Trend

According to TradingView, the Litecoin price is moving in a tight consolidation zone with the price ranging from $52.00 to $56.00 until an early-May breakout that proved to be only temporary. 

The Litecoin price broke through the 20 and 50 EMAs and reached a peak of close to $63.00 without managing to breach the 100 EMA barrier, retreating back to $56.22.

Litecoin technical analysis

Source: TradingView

Technically, signs of weakening bulls prevail. Bearish sentiment prevails overall, with the long-term moving average (200-day EMA) comfortably placed above at $67.04. 

On the other hand, the relative strength index has crossed below its yellow line to 48.06. Moving under the midline of 50 shows that sellers have taken charge as the Litecoin price battles to maintain its upward path.

This article contains market analysis and price predictions. These are not guarantees. Crypto markets are volatile. Always DYOR. Not financial advice.

Also Read: Litecoin Price Nears Key Resistance While Quiet LTC Accumulation Expands

Filed Under: Cryptocurrency News, Altcoin News, Litecoin (LTC)

Dogecoin Price Signals Major Breakout Potential as DOGE Targets $0.15

By Bena Ilyas | Edited By Ammar Raza,May 17, 2026, 12:00 PM

Dogecoin (DOGE) price is maintaining a sideways pattern amid a choppy momentum in the cryptocurrency market. Even though there may be little action currently in the short term, the current price configuration makes it clear that the Dogecoin price may be on the verge of breaking out in the coming sessions.

At the time of writing, DOGE is trading at $0.1105, with a daily trading volume of $1.29 billion and a market capitalization of $18.73 billion. DOGE experienced a slight gain of 1.23% over the last 24 hours, suggesting that the digital currency is holding steady despite the reduced level of market activity.

DOGE price chart
Source: CoinMarketCap

Also Read | Solana Price Faces Crucial Retest as Breakout Momentum Targets $120 and $145

Dogecoin Price Eyes Potential Breakout

On May 17, 2026, crypto analyst BitGuru noted that he remains attentive to DOGE since the pattern indicates that there is a significant consolidation period after a liquidity flush and decline. In his view, if the momentum continues to improve from the current level, the Dogecoin price can eventually reach the $0.13-$0.15 range.

DOGE price chart
Source: BitGuru’s X Post

This analysis highlights that Dogecoin’s price is at a critical stage when both buyers and sellers are vying for market supremacy. The meme currency will have to break out of its consolidation range to generate significant bullish momentum and attract investor attention once again.

DOGE Derivatives Cool as Investors Pull Back

Meanwhile, information on the derivatives market indicated slower movement within the last 24 hours. Open interest fell by 0.79% to $1.52 billion, while volume plunged by 39.17% to $1.62 billion. The reduction in volume indicates that many market players are being cautious amid ongoing uncertainties in the cryptocurrency industry.

DOGE open interest and volume chart
Source: Coinglass

Even when there was less trading going on, the funding rate for OI still remained positive at 0.0006%. This means that even if there is less leveraged trading going on, some traders believe that the Dogecoin price will rise soon.

DOGE OI Weighted chart
Source: Coinglass

This article contains market analysis and price predictions. These are not guarantees. Crypto markets are volatile. Always DYOR. Not financial advice.

Also Read | Ethereum Price Prediction Shows Over 110% Upside Toward $4,800 Breakout Zone

Filed Under: Cryptocurrency News, Dogecoin (DOGE)

Zcash Price Breaks Above $513 as Bullish Structure Signals Continued Upside

By Bena Ilyas | Edited By Messam Raza,May 17, 2026, 11:00 AM

Zcash price has strengthened its short-term structure after breaking out of a prolonged consolidation phase, with buyers gradually regaining control. Zcash (ZEC) trend reflects improving momentum supported by rising trading activity and a shift toward bullish market behavior, signaling potential continuation in the current uptrend.

Currently, the Zcash price is trading near the $517.12 level, which shows a 4.00% increase in price compared to the previous trading period. ZEC is recording high daily trading volumes of over $1.37 billion and currently has a market capitalization near the $8.56 billion level, accounting for 0.33% of the cryptocurrency market.

Zcash price chart
Source: CoinGecko

Also Read | SHIB Price Nears Breakout Zone as Falling Wedge Signals Major Move Ahead

Zcash Price Invalid Below $294 Level

A recent post shared by Crypto Patel on X highlights a bullish technical setup forming in Zcash, suggesting the asset may be positioned for a potential upward continuation. According to the analysis, ZEC has reacted strongly from a weekly fair value gap, followed by a market structure shift (MSS) that confirms a possible reversal in trend. 

Zcash price analysis
Source: Crypto Patel’s X Post

In addition, the Zcash price seems to be in a retracement phase, moving towards the order flow or the discount zone, which means buyers are likely accumulating the asset. Moreover, the analysis has spotted high-time frame liquidity above current levels and upside targets around $643 and $750 if the bullish setup persists.

However, the setup carries a defined invalidation level at a daily close below $294, which would negate the current bullish outlook for the Zcash price. Overall, the analysis suggests that ZEC may remain biased to the upside, but only if price confirms support within the retracement zone and maintains structural strength.

ZEC Reclaims Bullish Momentum

ZEC price continues to exhibit a bullish trend as it recovers from a flat correction that has been taking place for the past week. The latest developments indicate the emergence of renewed bullish momentum amid increasing buying activities.

Zcash technical price analysis
Source: TradingView

A key technical development is the reclaiming of a significant VWAP zone, which often acts as a dynamic support and trend-defining level. Moreover, the ZEC price has breached the 1.272 Fibonacci extension of the prior A-B wave, which means further continuation potential should be observed.

If the current bullish setup remains intact, market conditions suggest the possibility of further upside momentum in the near term. The next target for buyers appears to be near the $650 price region, as long as the price stays above the VWAP zone.

This article contains market analysis and price predictions. These are not guarantees. Crypto markets are volatile. Always DYOR. Not financial advice.

Also Read | FARTCOIN Price Analysis: Failed Breakout And Weak Support Raise Downside Risks

Filed Under: Cryptocurrency News

Harvard Endowment Exits Ethereum ETF, Reduces IBIT Holdings by 43%

By Bena Ilyas | Edited By Messam Raza,May 17, 2026, 10:14 AM

Harvard Endowment has significantly reduced its exposure, with Harvard University exiting its Ethereum ETF position while also trimming its cryptocurrency ETF holdings, according to released SEC 13F filings. The institution lowered its holdings in BlackRock’s iShares Bitcoin Trust ETF by nearly 43%, cutting its position to 3,044,612 shares valued at approximately $117 million during the reporting period.

The latest reduction followed a previous decrease reported during the fourth quarter of 2025, when Harvard trimmed its IBIT holdings by roughly 21%. The filing also revealed that the university completely exited its position in BlackRock’s iShares Ethereum Trust ETF, liquidating shares previously valued between $86.8 million and $87 million before the first-quarter adjustment period.

Q1 2026 SEC 13F filings
Source: sec.gov

Also Read | Aptos Price Prediction: APT Liquidity Sweep Suggests Potential Rally Toward $1.24

Institutional Investors Rebalance Ethereum ETF Exposure

Mubadala Investment Company increased its investment in Bitcoin ETF during the same quarter. The company raised its IBIT shareholdings to 14,721,917 units with an estimated value of $566 million, compared to 12,702,323 reported at the end of Q4 2025.

These adjustments were made during re-positioning in response to fluctuations in the market and Bitcoin being traded below $78,000. In a filing dated May 14, Harvard Management Company reported that Harvard University reduced its investment in the Bitcoin ETF while selling out its entire investment in its Ethereum ETF position.

Other U.S. university endowments also disclosed changes to their cryptocurrency-related investments through recent SEC filings. Dartmouth College maintained its shareholding of 201,531 units in BlackRock iShares Blockchain and Tech ETF with an estimated valuation of more than $9 million. The college replaced Ethereum shares with shares in the Grayscale Ethereum Staking ETF and purchased 304,803 shares in the Bitwise Solana Staking ETF.

University Endowments Maintain Crypto Market Exposure

Brown University retained its existing 212,500 shares in the iShares Blockchain ETF without reporting changes during the quarter. Meanwhile, Emory University streamlined its Bitcoin-related exposure by exiting a smaller IBIT position while increasing holdings in the Grayscale Bitcoin Mini Trust to 1,354,148 shares, according to the latest institutional investment disclosures.

According to Harvard University’s Q4 2025 filing, the university initially owned approximately 5.35 million IBIT shares, amounting to $265.8 million. However, institutional investments in ETFs and Ethereum ETF products remain popular despite recent adjustments due to fluctuating prices.

Also Read | Chainlink Price Tests Crucial Support as Bulls Eye $10.86 and $11.85 Targets

Filed Under: Cryptocurrency News, Ethereum (ETH)

  • « Go to Previous Page
  • Page 1
  • Interim pages omitted …
  • Page 64
  • Page 65
  • Page 66
  • Page 67
  • Page 68
  • Interim pages omitted …
  • Page 3666
  • Go to Next Page »

Primary Sidebar

Recent Posts

  • ALGO Price Forecast: Can it Break Above $0.1319 Resistance? June 6, 2026
  • XRP Price Struggles at $1 Support While Bullish Cycle Targets Stay Locked at $5, $10 June 6, 2026
  • Galaxy Research Warns CLARITY Act Could Face Major Delays in 2026 June 6, 2026
  • Binance Coin Price Holds $570 as Resistance Triggers Market Uncertainty June 6, 2026
  • Professional Bitcoin Holdings Fall 17% as Hedge Funds Exit Positions June 6, 2026

Footer

News

  • Latest News
  • Altcoin News
  • Bitcoin (BTC)
  • Blockchain
  • Tron (TRX)
  • World

Digest

  • Meet the Founder
  • Price Winning Article
  • DeFi
  • Cyber Security
  • Crypto Scam

Industry

  • Project Review
  • Technology
  • Fintech
  • Tron Exchange
  • New in Town

Tron Universe

  • Event and Tron Parties
  • New in Town
  • Tron Tokens

FOLLOW US

  • Facebook
  • Telegram
  • Twitter
  • Linkedin

Subscribe US

Editorial Policy | Privacy Policy | Disclaimer | Terms and Conditions | Masthead

Copyright © 2026 · Tron Weekly. All Rights Reserved. NOTE: Tron Weekly is an independent crypto news site that adheres to the strict journalism policy anchored on transparency, trust, and objectivity, we have no affiliation with the TRON Foundation, its founder Justin Sun or any other cryptocurrency firm.