• Skip to primary navigation
  • Skip to main content
  • Skip to primary sidebar
  • Skip to footer
  • About TronWeekly
  • Write for us
  • Terms and Conditions
  • Privacy Policy
  • Disclaimer
  • Contact
  • All Posts
  • Advertise

TronWeekly

Crypto World News

  • Home
  • Latest News
  • Opinion
    • Education
    • Best TRON Wallets
    • Beginner’s guide to TRON
    • Tron Tokens
    • Market Analysis
  • Industry
    • Tron Exchange
    • Project Review
  • Press Release
  • Bitcoin (BTC)
  • Ripple (XRP)
  • Advertise
  • About TronWeekly
    • The Team
    • Editorial Policy
    • Write for us
    • Privacy Policy
    • Disclaimer
    • Terms and Conditions
    • Contact
You are here: Home / All Posts

All Posts

ASTER Price Analysis: Consolidation Phase Signals Potential Breakout to $2.42

By Sadia Ali | Edited By Ammar Raza,May 16, 2026, 10:00 PM

ASTER is consolidating after a prolonged decline, with low volatility and weak sentiment. The ASTER price remains range-bound as selling pressure eases. RSI and MACD show neutral to bearish momentum, suggesting ongoing consolidation until a confirmed breakout above key resistance levels occurs. According to CoinMarketCap, ASTER is trading at $0.6603 with a daily decline of 2.01%.

ASTER price chart

Source: CoinMarketCap

Also Read: Aster Faces Downside Risk After $22.9 Million Whale Movement Hits Market

ASTER Price Shows Signs of Major Reversal Setup

Furthermore, the crypto analyst Spermix pointed out that ASTER is still in an early phase where most traders remain disengaged, yet the ASTER price structure suggests stabilization after prolonged post-launch weakness. 

Repeated rejection of recovery attempts has faded into tighter volatility, hinting that selling pressure is easing. Markets often shift from panic into boredom before meaningful momentum begins forming again quietly across lower timeframes now.

The range is being compressed by three important resistance zones coming up at $0.94, $1.39, and $2.42. If the bullish momentum returns, the ASTER price will face a possible structural turning point at these key levels. 

In cryptocurrency cycles, the path doesn’t take an easy route from the weakness stage directly to the expansion stage; it takes a meandering journey through the stage of disbelief.

ASTER price chart

Source: spermix’s X Post

If the ASTER price manages to push past these barriers and remain above them, sentiment could shift very quickly as inactive traders rush to price the trend. 

But most people will only act after the confirmation is there, at which point most of the move will be exhausted. With cryptocurrencies, there is value in getting positioned early when there is still uncertainty, since perception always lags behind reality.

ASTER Technicals Point to Consolidation Phase

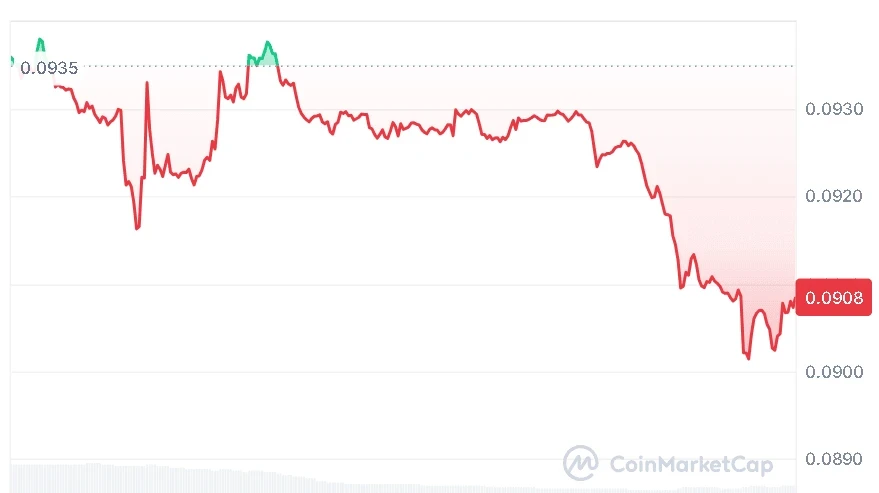
According to TradingView, the ASTER price is experiencing a quiet period following a steep decline at the tail end of February. 

The ASTER price movements have mainly been ranging sideways between $0.63000 and $0.70000. A brief spike in early May to the $0.73000 level quickly turned into a bearish trend with declining peaks. The current level of the price is at $0.66047, indicating an advantage for sellers amid this trading range.

ASTER Technicals Point to Consolidation Phase

Source: TradingView

The technical indicators suggest that the momentum is starting to slow down. The relative strength index is at the neutral level of 45.13 and has moved below its moving average, suggesting that the sellers have control. 

Meanwhile, the MACD line is starting to flatten below its signal line, while the histogram is increasing in size, confirming the lack of upward momentum.

This article contains market analysis and price predictions. These are not guarantees. Crypto markets are volatile. Always DYOR. Not financial advice.

Also Read: Aster (ASTER) Bulls Defend $0.62 Support Amid Bearish Pressure

Filed Under: Cryptocurrency News

LINK Price Prediction: Can ETF Inflows and Institutional Demand Push It to $100?

By Mishal Ali | Edited By Messam Raza,May 16, 2026, 9:00 PM

Chainlink (LINK) shows mixed signals, with long-term bullish forecasts driven by ETF inflows and institutional accumulation contrasting with short-term weakness after a failed breakout. Meanwhile, its CCIP integration with Tempo boosts cross-chain Bitcoin liquidity and interoperability, supporting broader adoption of decentralized financial infrastructure. According to CoinMarketCap, the LINK price is standing at $9.63 with a daily decline of 5.67%.

LINK current price

Source: CoinMarketCap

LINK Price Targets $100 Amid ETF Inflows

Furthermore, the crypto analyst Crypto Patel revealed that Chainlink has recently become the focus of renewed market speculation, with some analysts suggesting a potential long-term path toward $100 from lower trading levels. 

The bullish narrative is largely driven by ETF-linked accumulation, tightening circulating supply, and rising institutional interest, which are being interpreted as early indicators of strategic positioning by larger market participants.

LINK price prediction

Source: Crypto Patel’s X Post

Additional attention comes from reports claiming that 1.63% of total supply is held within ETF structures, alongside approximately $123M in U.S. spot Chainlink ETF exposure and consistently low or zero outflows since launch. 

While proponents see this as evidence of smart money accumulation, analysts warn that such flows can shift rapidly, and long-term projections for the LINK price remain speculative, dependent on adoption, regulation, and broader crypto market cycles.

Also Read: Chainlink Price Prediction: Can LINK Price Break $15 After Strong Recovery?

Technical Indicators Point to Cautious Optimism

According to TradingView, the LINK price falls rapidly at the beginning of 2026 to $7.30, and it will stay there for several months until April. 

An impressive breakout in early May sends the LINK price past the $10.00 level, but the coin got rejected around the $11.00 mark. The LINK price has experienced a rapid decline of 4.12% and is currently trading under the 20-day moving average at $9.655.

LINK price analysis

Source: TradingView

The technical signals clearly indicate the sudden shift towards bearishness. The green bars of the MACD histogram have turned red. 

The blue-colored MACD line has crossed below the orange-colored signal line, indicating a bearish crossover. As momentum has shifted to the downside, further retracement appears possible towards the lower Bollinger Band support level of $8.68.

Tempo Expands Crypto Payments with Chainlink CCIP

Apart from the LINK price movements, Tempo, a layer one blockchain with a focus on payment systems and developed by Stripe and Paradigm, has incorporated Chainlink CCIP technology into its network to enable cross-chain support for Coinbase Wrapped Bitcoin, which is a multi-billion dollar circulating token. 

By doing so, Tempo will incorporate the biggest crypto-wrapped representation of Bitcoin onto their network.

Tempo Expands Crypto Payments with Chainlink CCIP

Source: Chainlink’s X Post

Through leveraging the Chainlink CCIP protocol, Tempo delivers strong cross-chain interoperability on a massive scale, reducing reliance on traditional bridges and increasing security for cryptocurrencies to an institutional standard. 

By integrating Coinbase Wrapped Bitcoin, Tempo will enable this cryptocurrency to be transferred to decentralized applications, providing improved Bitcoin liquidity and capital efficiency.

This article contains market analysis and price predictions. These are not guarantees. Crypto markets are volatile. Always DYOR. Not financial advice.

Also Read: Kraken Selects Chainlink CCIP for Cross-Chain kBTC

Filed Under: Cryptocurrency News, Chainlink (LINK)

VIRTUAL Price Faces Resistance at $0.80: Can Bulls Push It Toward $1 Target?

By Mishal Ali | Edited By Ammar Raza,May 16, 2026, 8:00 PM

Virtuals Protocol (VIRTUAL) is pulling back from recent highs and testing key support while facing strong resistance that is limiting upside momentum. Technical indicators show weakening momentum and increasing bearish pressure for the VIRTUAL price. Derivatives data also reflects caution, with lower participation, reduced leverage, and declining trading activity overall. According to CoinMarketCap, VIRTUAL is trading at $0.7217 with a daily decline of 4.99%.

VIRTUAL current price

Source: CoinMarketCap

VIRTUAL Derivative Data Point to Cautious Optimism

According to Coinglass, the VIRTUAL open interest declined by 8.67%, totaling $85.79 million, indicating reduced outstanding derivative positions and weakening trader commitment. This suggests lower leverage usage, increased position unwinding, and cautious sentiment in the market.

VIRTUAL open interest and volume

Source: Coinglass

Trading volume decreased by 17.19%, reaching $106.95 million, indicating reduced market activity and weaker participation compared to previous levels, reflecting lower liquidity, cautious sentiment among traders, and short-term hesitation in executing larger market positions.

Also Read: VIRTUAL Bullish Setup and Rising Open Interest Point to a Rally Toward $0.90

VIRTUAL Price Breakout Could Trigger $1 Rally

Furthermore, the crypto analyst Scient pointed out that the VIRTUAL price seems to be building a solid bullish pattern by progressively establishing new highs and lows within an uptrend channel formation. 

The VIRTUAL price has targeted the critical resistance level of $0.78-$0.80, which has acted as the ceiling for any gains since January. The upside breakout will strengthen the trend further.

VIRTUAL price prediction

Source: Scient’s X Post

The region corresponds to the Value Area High that formed during the initial May breakout period and is located close to the 0.75 Fibonacci box. 

As long as the bulls can keep the support intact and maintain their momentum, a rise towards the psychological $1 mark should be expected. Otherwise, in case of rejection at the resistance, the range-bound motion will continue.

Technical Indicators Point to Downward Pressure

According to TradingView, the VIRTUAL price has corrected sharply from its peak level of $0.95000 in the first week of May. 

The VIRTUAL price is down by 3.69% to reach the price level of $0.72140. Now, the price is approaching the important resistance range of $0.70000 – $0.72000. If the price breaks below this critical range, then a fall to $0.65000 is expected.

VIRTUAL technical analysis

Source: TradingView

The technicals are starting to paint the picture of an acceleration to the downside as the RSI falls from overbought readings into 42.22, falling significantly below the signal line. 

Meanwhile, the MACD is generating a fresh bearish crossover as the blue line crosses below the orange signal line, along with widening red bars.

This article contains market analysis and price predictions. These are not guarantees. Crypto markets are volatile. Always DYOR. Not financial advice.

Also Read: VIRTUAL Price Forecast: Can Bulls Reclaim $0.80–$0.82 for Further Upside?

Filed Under: Cryptocurrency News, Altcoin News

FET Price Outlook: Can Buyers Break Resistance and Reach $0.60?

By Tina Fatima | Edited By Ammar Raza,May 16, 2026, 7:00 PM

Artificial Superintelligence Alliance (FET) price faces ongoing selling pressure as bearish sentiment dominates recent sessions. Price continues weakening across timeframes despite higher trading activity. Momentum remains soft, and buyers struggle to regain control, keeping the token vulnerable to further downside unless stronger support and demand emerge soon.

FET Struggles Under Heavy Selling Pressure

Artificial Superintelligence Alliance (FET) has faced renewed selling pressure, showing weakness across recent trading sessions. The token declined nearly 6.77% over the past 24 hours, reflecting short-term profit-taking and fading momentum after recent moves.

On the broader timeframe, FET also remained under pressure, posting an 18.41% weekly decline. Despite intermittent buying attempts, overall sentiment stays cautious as sellers continue to dominate market direction.

FET current price chart
Source: CoinMarketCap

According to the CoinMarketCap data, the token is trading at $0.1954 amid rising market participation. The 24-hour trading volume has climbed to $190.31 million, reflecting a 15.07% increase, indicating stronger trading activity across the market.

Meanwhile, the market capitalization stands at $441.02 million, down by 6.75% over the same period. This divergence suggests that while liquidity and activity are increasing, overall valuation pressure is still weighing on short-term momentum.

Also Read: FET Price Analysis: The Price Could Fall Further If $0.20 Support Fails

Price Structure Holds Critical Support Zones

FET price is trading inside a long-term descending channel on the 3-day chart, while recently reclaiming the yellow descending trendline near $0.18–$0.20.

This breakout suggests weakening bearish momentum and possible accumulation. Upside targets shown include $0.25, $0.28, and eventually the $0.50–$0.60 resistance zone ahead, according to crypto analyst Dami-Defi.

The FET price consolidation around higher prices shows an increasing strength of buying pressure amid a prolonged downtrend characterized by lower lows and lows. It will be vital to hold above the level of $0.18 in order to continue the positive trend dynamics.

FET price prediction chart
Source: @DamiDefi

The key obstacles to further upside are seen at $0.25–$0.28, followed by $0.35, before any larger continuation toward channel resistance develops.

In case of a bearish trajectory, the scenario will develop if FET is unable to withstand the $0.18 resistance level and heads for the substantial support region of around $0.14-$0.16.

A breakout below the bottom side of the falling channel can generate further selling activity. However, with higher lows remaining intact, the probability favors reaching the anticipated upside objective at $0.50-$0.60 eventually.

Momentum Indicators Signal Ongoing Bearish Bias

According to TradingView, the RSI on FET signals weakening bullish sentiment, declining to 38.30 amid a signal mean of 51.83. This move below the halfway mark indicates weak buying pressure and increased bearishness.

Although it is still not in oversold territory, this suggests that investors should remain cautious in the short term.

FET tradingview chart
Source: TradingView

The MACD indicates that bearish momentum is expected to persist. The MACD line has moved to -0.00144 and is located below the signal line of 0.00056.

The histogram is positioned slightly above -0.00200, indicating that bearish momentum is gaining strength. This is seen from the series of red histogram bars, which indicate that sellers are in control.

This article contains market analysis and price predictions. These are not guarantees. Crypto markets are volatile. Always DYOR. Not financial advice.

Also Read: Fetch.ai Recovery Gains Strength: FET Price Could Surge to 300% Ahead

Filed Under: Altcoin News

CHZ Price Prediction: Bulls Target $0.40 as 5-Year Resistance Is Tested

By Mishal Ali | Edited By Messam Raza,May 16, 2026, 6:00 PM

The Chiliz (CHZ) price is consolidating near long-term resistance after recovery, showing tight compression. Technicals are neutral with balanced momentum above key averages. Derivatives show steady positioning and rising participation, while higher volume reflects increased market engagement. According to CoinMarketCap, the CHZ price is standing at $0.04435 with a daily decline of 2.16%.

CHZ current price

Source: CoinMarketCap

CHZ Derivative Data Point to Improving Strength

According to Coinglass, the CHZ open interest rose by 2.20%, reaching $64.47 million, indicating steady positioning growth, moderate leverage participation, and consistent derivatives engagement across the market, reflecting stable investor sentiment and ongoing capital commitment from traders.

CHZ open interest and volume

Source: Coinglass

Volume increased by 83.15%, reaching $167.10 million, indicating strong trading activity, heightened liquidity, and increased market participation, reflecting improved demand conditions and strong engagement from traders within the broader market environment.

Also Read: Chiliz Price Prediction: Will CHZ Break Resistance or Continue Sideways Trading?

CHZ Price Eyes Breakout After Years of Consolidation

Furthermore, the crypto analyst Javon Marks highlighted that the CHZ price is testing an important level of resistance that has been present for nearly five years, with investors looking forward to the possibility of a structural breakout. 

There seems to be a pattern forming near the resistance level, suggesting a period of consolidation before a potential breakout in the CHZ price.

CHZ price prediction

Source: Javon Marks’ X Post

If the breakout is confirmed to be true and comes along with significant volumes and follow-up action, there may be suggestions that such a breakout can lead to a big move upwards, potentially bringing the price back up near the $0.40 region. 

However, confirmation is needed as resistance breakouts in a multi-year time frame are usually tested amid any volatility.

Technical Indicators Point to Upward Consolidation

According to TradingView, the CHZ price follows an unpredictable course, starting off with a sudden drop during the initial part of the year before consolidating. 

Since managing to establish itself at $0.0300 in March, the CHZ price managed to bounce back and test its resistance level at $0.0510. The CHZ price is currently sitting at $0.0442, a position slightly higher than its significant EMAs.

CHZ technical analysis

Source: TradingView

The RSI with a period of 14 is neutral and flattening out towards the middle after backing away from overbought levels. 

The RSI at the level of 51.87 is slightly above its signal line at 51.34, indicating that bulls and bears are equally powerful, implying that the CHZ price may be coiling up for its next move.

This article contains market analysis and price predictions. These are not guarantees. Crypto markets are volatile. Always DYOR. Not financial advice.

Also Read: Chiliz Price Prediction: CHZ Signals Possible 2,700% Rally

Filed Under: Cryptocurrency News

XRP Price Breakout Above $1.56 Could Trigger Strong Upside Rally Move

By Bena Ilyas | Edited By Ammar Raza,May 16, 2026, 5:00 PM

XRP price has experienced a temporary pullback while still trading in a consolidation range, amid market indecision. Despite recent weakness, network activity is increasing after an initial short-lived upside move in the previous week.

Currently, XRP is trading around $1.42, reflecting a 3.36% decline over the past 24 hours. The asset had a trading volume of $3.03 billion, a market cap of $87.50 billion, and a market dominance of 3.34%. Despite experiencing a temporary pullback, recent on-chain activities show a significant surge in network activity after a temporary price break above $1.54.

XRP price chart
Source: CoinGecko

Also Read | Dogecoin Price Could Rebound Toward $0.15 if Buyers Regain Momentum

XRP Price Saw Breakout Above $1.54 Level

According to the latest intelligence report from Santiment, there was a notable boost in XRP network activity after the crypto asset broke out of the $1.54 mark. It shows that there were about 48,453 active addresses within a day, which was the highest in four months since March 30. 

XRP price analysis
Source: Santment’s X Post

In addition, there were 3,317 new addresses, which showed strong network activity since March 19. These surges indicate higher engagement with the XRP ledger during the recent price expansion phase. Most of these rises are associated with increased interest during the rally, where many users engage with the network. 

While short-term price rallies might be driven by short-lived hype, higher transaction volumes are seen to support long-term value creation, due to greater blockchain usage.

XRP Support Breakdown Risks Further Decline

Based on technical analysis, XRP has been moving sideways for about five weeks. The asset is contained between a $1.3671 support level and a $1.5625 resistance level, creating a tight range. This setup shows a neutral phase, where neither buyers nor sellers have taken full control.

XRP technical price analysis
Source: TradingView

Momentum signals remain mixed. The MACD indicator is still slightly positive, showing some underlying strength, while the Stochastic indicator is starting to turn downward, hinting that upward pressure is slowing. This combination suggests the market is waiting for a clear breakout direction.

In case of an upside breakout above $1.5625, a bullish rally towards $1.9980 and $2.3519 is expected. On the contrary, if the XRP price breaks down below the $1.3671 mark, further downside targets of $1.2695, $1.1718, and $1.0742 are expected.

This article contains market analysis and price predictions. These are not guarantees. Crypto markets are volatile. Always DYOR. Not financial advice.

Also Read | Hyperliquid (HYPE) Price Eyes $100 Target Amid Strong Bullish Momentum

Filed Under: Cryptocurrency News, Ripple (XRP)

HBAR Price at Crossroads With $0.103 Resistance in Focus

By Bena Ilyas | Edited By Ammar Raza,May 16, 2026, 4:00 PM

Hedera Hashgraph (HBAR) price has entered a weak consolidation phase after facing selling pressure. Its price direction is highly unpredictable, with upward momentum failing to gather steam. The subsequent move will depend on whether the support level is breached or defended in the coming days.

At the time of writing, HBAR is trading at $0.09081. Over the last 24 hours, the HBAR price has dropped by 3.05%, while trading volume stands at $119.82 million and market capitalization is around $3.93 billion. The recent movement shows that the HBAR  is still struggling to build strong upward continuation after short rebounds.

HBAR price chart
Source: CoinMarketCap

Also Read | Cardano Price Holds $0.25 Support as Wealth Tech Forum Sparks Optimism

HBAR Price Remains in Correction

On May 16, 2026, crypto analyst More Crypto Online revealed that HBAR’s price is still undergoing a corrective recovery stage. Although there have been a couple of rebounds from the lows recorded during March and April, the rebound does not yet show any sign of becoming a trend.

According to the primary view, the price of HBAR might still move a little higher to reach a downtrend line marked in yellow, with resistance anticipated at $0.103. This situation remains relevant as long as the HBAR price maintains its support level of $0.078 – $0.088.

HBAR price chart
Source: More Crypto Online’s X Post

The risk setup regarding the HBAR is triggered when it drops beneath the recent swing low at $0.087. The violation of the mentioned support level will make the short-term outlook bearish and boost the likelihood that the previous bullish trend is over.

Support areas for the HBAR price stand at $0.088, $0.087, and $0.078, with resistance positioned around $0.103. In general, the HBAR price is still undergoing corrective recovery dynamics and does not demonstrate any clear bullish force.

HBAR Price Momentum Starts to Slow

In terms of technical analysis, the RSI of the HBAR stands at 47.36, with its moving average standing at 55.31. The fall below the neutral point of 50 indicates that the strength of the buying pressure is declining following the rally in May.

HBAR technical indicator chart
Source: TradingView

Moreover, the MACD remains slightly bullish. The MACD line stands at 0.00098, while the signal line stands at 0.00095, with the histogram being slightly positive, at 0.00003. This implies that buyers are still holding the upper hand, although the narrowing spread between the two lines means that the HBAR price may lose momentum soon.

This article contains market analysis and price predictions. These are not guarantees. Crypto markets are volatile. Always DYOR. Not financial advice.

Also Read | Dogecoin Price Could Rebound Toward $0.15 if Buyers Regain Momentum

Filed Under: Cryptocurrency News

DASH Price Could Surge Toward $143 if Bulls Maintain Key Support Level

By Sajjal Ali | Edited By Ammar Raza,May 16, 2026, 2:00 PM

DASH is attempting a recovery after defending key support following a falling wedge breakout. Technical indicators show weakening short-term momentum as the DASH price tests major EMAs. Meanwhile, declining open interest and trading volume reflect cautious sentiment and reduced trader participation in the derivatives market. According to CoinMarketCap, DASH is trading at $41.12 with a daily decline of 9.02%.

DASH current price

Source: CoinMarketCap

Open Interest and Volume Shows Decreasing Activity

According to Coinglass, the DASH open interest declined by 15.01%, falling to $56.03 million. This decrease indicates that traders are closing positions and reducing exposure in the market. Lower open interest often reflects weakening participation, declining speculative activity, or expectations of reduced volatility in the near term.

DASH open interest and volume

Source: Coinglass

Trading volume also dropped significantly by 26.89%, settling at $73.64 million. The decline suggests lower market activity and reduced engagement from investors. Such a decrease may point to cautious sentiment among traders and a temporary slowdown in overall market momentum.

Also Read: DASH Price Prediction: Breakout Setup Could Trigger Rally Toward $476

DASH Price Eyes $143 as Bulls Defend Key Support

Furthermore, the crypto analyst Jonathan Carter pointed out that Dash has started moving upwards as it managed to break out of a tested broken falling wedge formation. 

The move is expected to be continued due to the support from buyers who have managed to defend all key support levels, hence creating market confidence. The experts anticipate the next bull trend due to the retested confirmation.

DASH price prediction

Source: Jonathan Carter’s X Post

As the DASH price targets an extension of its recovery rally, market analysts have begun focusing on its recovery levels. 

These levels include $58 and $71, and with an increased bullish momentum, they can be driven to levels of $89 and $104. With more bullish momentum in the wider cryptocurrency sector, the DASH price may target levels up to $143.

Technical Indicators Point to Decreasing Strength

According to TradingView, the trend for DASH starts from a severe fall, followed by an initial attempt to recover. The DASH price hit its peak near $90.00 before falling with precision throughout March to reach $30.00. 

A strong positive breakout at the start of May saw the price of Dash surpass $58.00, only to undergo a significant retracement afterward.

DASH technical analysis

Source: TradingView

Currently, the DASH price hovers at roughly $41.018, below its 20-day exponential moving average (EMA). This is the point where the DASH price is testing support, as all three critical averages, i.e., the 50-, 100-, and 200-day EMAs, are at $40.00. 

With regards to the RSI, the indicator currently stands at 46.68, indicating bearish short-term pressure on the asset.

This article contains market analysis and price predictions. These are not guarantees. Crypto markets are volatile. Always DYOR. Not financial advice.

Also Read: DASH Price Prediction: Bulls Target $50 as Structure Turns Positive

Filed Under: Cryptocurrency News, Altcoin News

Ethereum Price Approaches Critical Support as Bulls Eye $2,280 and $2,390 Levels

By Bena Ilyas | Edited By Ammar Raza,May 16, 2026, 1:00 PM

Ethereum (ETH) price trend is bearish on May 16, 2026, as the overall cryptocurrency market continued to experience low trading volumes and lackluster performance. Although there have been some setbacks for the crypto market, market watchers expect the Ethereum price to test an essential support level that may spark a rally in the near future.

At the time of writing, ETH is trading at $2,175.5 with a 24-hour trading volume of $16.22 billion and a market capitalization of $263.96 billion. According to CoinMarketCap, the Ethereum price dropped 3.45% over the last 24 hours, reflecting continued selling pressure across the market.

ETH price chart
Source: CoinMarketCap

Also Read | Ethereum Price Weakens Short-Term but Long-Term Target Remains $5,000

Ethereum Price Approaches Lower Channel Support

On May 16, 2026, a renowned crypto analyst, Ali Martinez, released a report where he highlighted the fact that the price of Ethereum had dropped back to its bottom trading range. From his analysis, it can be inferred that this could be a good buying opportunity for investors.

ETH 4-hour price chart
Source: Ali Martinez’s X Post

Martinez says that should the buying push grow from the current levels, the price of Ethereum would rise toward the middle of the channel level at $2,280. With a stronger bounce, the price of Ethereum could rise to $2,390.

Ethereum derivatives show mixed signals

While the price movement is in progress, the derivatives market gave contradictory results. The open interest rose by 1.93% to reach $33.74 billion, demonstrating that there is still an interest among the market players to initiate positions under unstable circumstances. Nevertheless, the total trading volume dropped by 20.87% to be at $41.09 billion.

ETH open interest and volume chart
Source: Coinglass

Meanwhile, the OI-weighted funding rate remained positive at 0.0049%, indicating that many derivatives investors anticipate a quick rebound in the price of Ethereum soon. Despite the slowdown in trading, a positive funding rate indicates that there is a minor bullish bias towards buying Ethereum.

ETH OI Weighted chart
Source: Coinglass

This article contains market analysis and price predictions. These are not guarantees. Crypto markets are volatile. Always DYOR. Not financial advice.

Also Read | XRP Price Builds Long-Term Setup as Fibonacci Extensions Target $8

Filed Under: Cryptocurrency News, Ethereum (ETH)

Aptos (APT) Price Forecast: KRW1 Integration Boosts Bullish Case Toward $1.24

By Tina Fatima | Edited By Ammar Raza,May 16, 2026, 11:33 AM

Aptos (APT) price remains under pressure despite strengthening sentiment surrounding the KRW1 stablecoin integration backed by BDACS Korea. While the broader market structure still supports bullish continuation, RSI and MACD indicators show fading momentum and increasing short-term selling pressure across the market.

Aptos Price Holds Bullish Structure Despite Pullback

APT price remains inside a broader recovery structure after rebounding strongly from March lows near the major order block zone.

Price swept external liquidity several times before establishing higher lows and breaking above previous consolidation resistance. Recent rejection near the upper range signals temporary exhaustion and short-term selling pressure emerging.

The highlighted order block between the mid-$0.80 and low-$0.90 region continues acting as the chart’s strongest demand area.

APT price is now retracing toward this support after failing to maintain momentum above recent highs. The SSL region near $0.98 could provide temporary stabilization before another directional move develops.

APT Price Prediction chart
Source: @CryptoPatel

Overall market structure still favors bullish continuation because the APT price has shifted from forming lower lows toward establishing higher highs.

Previous breakout confirmation supports long-term upside potential if buyers defend the highlighted demand zone.

A strong rebound could drive the price toward external liquidity near the $1.24 resistance region, according to the crypto analyst Crypto Patel.

Also Read: Aptos Price Forecast: Could APT Surge to $1.14 in the Coming Sessions?

RSI and MACD Signal Growing Bearish Momentum

From an indicator perspective, the RSI (14) currently holds a value of 43.30 and is now below the yellow line of 58.68.

This is indicative of increasing bearish momentum that will move the price away from overbought territory, where it currently is in a neutral position, but fast approaching oversold territory.

APT tradingview chart
Source: TradingView

The MACD indicates that there is a bearish crossover happening as the MACD line turns blue below the signal line, which is orange at 0.03206.

Additionally, there has been a change in the color of the histogram to red at -0.01197, indicating an increase in short-term selling pressure.

KRW1 Stablecoin Boosts Aptos Commerce Expansion

Despite the price action, the introduction of the KRW1 stablecoin project is driving up the bull sentiment for Aptos as the platform continues its deeper integration in Asia’s digital payment landscape.

Backed by BDACS Korea, the KRW pegged stablecoin may help drive on-chain transactions, increase liquidity, and bring in institutions.

This event will reinforce Aptos’ position as the underlying structure of scalable finance applications and machine-enabled transactions.

Considering the growing interest among Koreans in regulated stablecoins, the project may demonstrate steady price growth in the coming years due to the continued development of commerce-related projects on top of the fast-growing blockchain platform.

This article contains market analysis and price predictions. These are not guarantees. Crypto markets are volatile. Always DYOR. Not financial advice.

Also Read: Aptos (APT) Price Prediction: Can $2 Flip Open Path to $18?

Filed Under: Altcoin News

  • « Go to Previous Page
  • Page 1
  • Interim pages omitted …
  • Page 66
  • Page 67
  • Page 68
  • Page 69
  • Page 70
  • Interim pages omitted …
  • Page 3666
  • Go to Next Page »

Primary Sidebar

Recent Posts

  • ALGO Price Forecast: Can it Break Above $0.1319 Resistance? June 6, 2026
  • XRP Price Struggles at $1 Support While Bullish Cycle Targets Stay Locked at $5, $10 June 6, 2026
  • Galaxy Research Warns CLARITY Act Could Face Major Delays in 2026 June 6, 2026
  • Binance Coin Price Holds $570 as Resistance Triggers Market Uncertainty June 6, 2026
  • Professional Bitcoin Holdings Fall 17% as Hedge Funds Exit Positions June 6, 2026

Footer

News

  • Latest News
  • Altcoin News
  • Bitcoin (BTC)
  • Blockchain
  • Tron (TRX)
  • World

Digest

  • Meet the Founder
  • Price Winning Article
  • DeFi
  • Cyber Security
  • Crypto Scam

Industry

  • Project Review
  • Technology
  • Fintech
  • Tron Exchange
  • New in Town

Tron Universe

  • Event and Tron Parties
  • New in Town
  • Tron Tokens

FOLLOW US

  • Facebook
  • Telegram
  • Twitter
  • Linkedin

Subscribe US

Editorial Policy | Privacy Policy | Disclaimer | Terms and Conditions | Masthead

Copyright © 2026 · Tron Weekly. All Rights Reserved. NOTE: Tron Weekly is an independent crypto news site that adheres to the strict journalism policy anchored on transparency, trust, and objectivity, we have no affiliation with the TRON Foundation, its founder Justin Sun or any other cryptocurrency firm.