• Skip to primary navigation
  • Skip to main content
  • Skip to primary sidebar
  • Skip to footer
  • About TronWeekly
  • Write for us
  • Terms and Conditions
  • Privacy Policy
  • Disclaimer
  • Contact
  • All Posts
  • Advertise

TronWeekly

Crypto World News

  • Home
  • Latest News
  • Opinion
    • Education
    • Best TRON Wallets
    • Beginner’s guide to TRON
    • Tron Tokens
    • Market Analysis
  • Industry
    • Tron Exchange
    • Project Review
  • Press Release
  • Bitcoin (BTC)
  • Ripple (XRP)
  • Advertise
  • About TronWeekly
    • The Team
    • Editorial Policy
    • Write for us
    • Privacy Policy
    • Disclaimer
    • Terms and Conditions
    • Contact
You are here: Home / All Posts

All Posts

Grayscale and VanEck Update BNB ETF Filings as SEC Review Intensifies

By Bena Ilyas | Edited By Ammar Raza,May 16, 2026, 10:25 AM

BNB ETF market is witnessing renewed momentum as major asset managers continue refining their filings under the ongoing U.S. Securities and Exchange Commission (SEC) review process. These amendments imply continued efforts toward launching spot BNB ETFs amid competition from rival crypto investments.

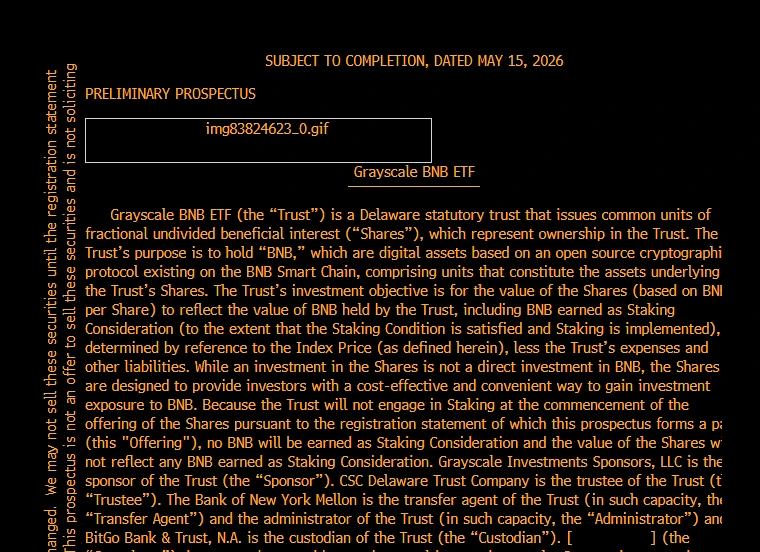
Bloomberg ETF analyst James Seyffart reported that Grayscale Investments has submitted a second amended S-1 filing for its proposed spot BNB ETF. The updated document indicates the firm may be incorporating feedback from the SEC as part of the ongoing review process for potential approval in the United States market.

Grayscale and VanEck BNB ETF
Source: James Seyffart’s X Post

VanEck filed its fifth amended prospectus for a BNB ETF on the same day, implying that issuers continue to engage regulators to ensure compliance with regulatory requirements in the US.

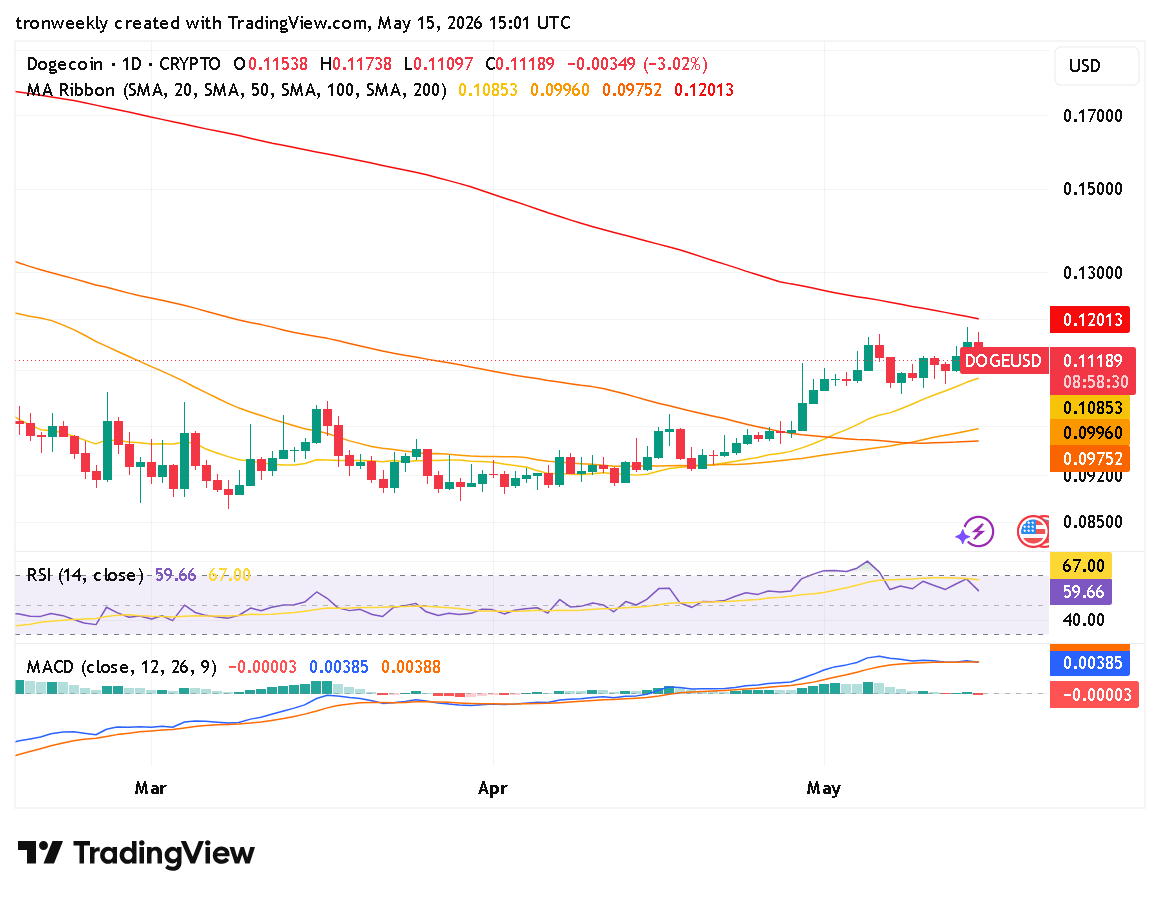
Also Read | Dogecoin Price Could Rebound Toward $0.15 if Buyers Regain Momentum

SEC Review Drives Continued ETF Filings Momentum

Canary Capital submitted its first amended filing for a Staked TRX ETF linked to the TRON ecosystem. The proposed structure combines exposure to TRX with staking yield features, reflecting expanding interest in hybrid crypto exchange-traded products within regulated frameworks being evaluated by U.S. financial authorities during the ongoing review cycle process.

On the other hand, T. Rowe Price filed the fourth amendment on its crypto ETF proposal, which reflects the growing number of amendments from issuers who are trying to meet the SEC’s demands for regulatory compliance. Multiple amendments from different issuers reflect continued discussions between issuers and the SEC as they evaluate various crypto investment applications.

Growing Institutional Focus on BNB ETF and Altcoin Exposure

Recent filings demonstrate increasing competition among asset managers seeking exposure to alternative digital assets beyond Bitcoin and Ethereum. BNB-focused ETF proposals and staking-based products tied to TRX reflect broader efforts to expand institutional access through regulated investment vehicles in the evolving cryptocurrency market landscape under the SEC oversight framework and regulatory.

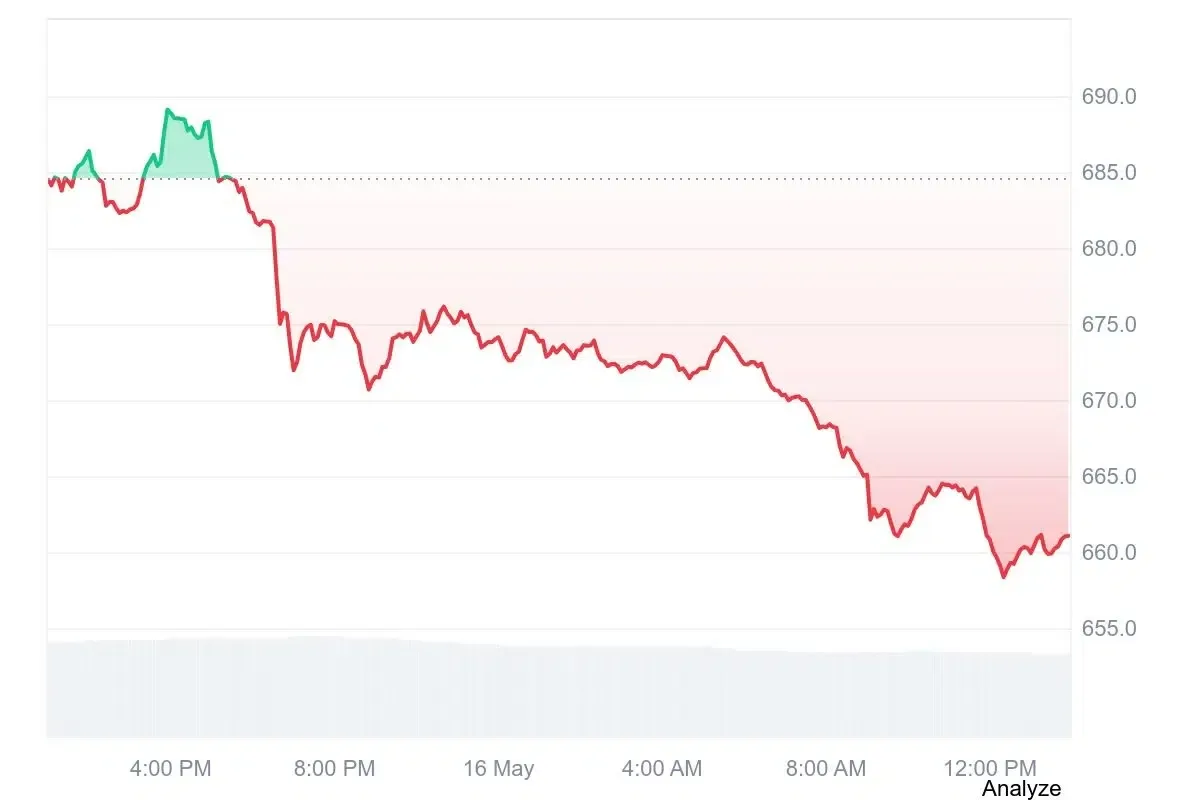
BNB is currently trading at $661.06, with a 24-hour trading volume of $1.66 billion, and a market cap of $88.92 billion, making up 3.40% of the crypto market. At the time of writing, BNB had fallen by 3.20% over the past 24 hours.

BNB price chart
Source: CryptoMarketCap

This article contains market analysis and price predictions. These are not guarantees. Crypto markets are volatile. Always DYOR. Not financial advice.

Also Read | Cardano Price Holds $0.25 Support as Wealth Tech Forum Sparks Optimism

Filed Under: Cryptocurrency News, Binance Coin (BNB)

XRP Price Builds Long-Term Setup as Fibonacci Extensions Target $8

By Zagham Abbas | Edited By Messam Raza,May 16, 2026, 8:00 AM

XRP price action continues to struggle because of its movement inside a tight consolidation formation. This is being closely observed by investors who want to know if the price of XRP will break out or break down from its current position.

At press time, the XRP is trading at $1.43 with a 5.09% decline over the last 24 hours. Despite the drop, trading activity remains strong with $5.06 billion in 24-hour volume and a $89.01 billion market capitalization, according to CoinMarketCap.

XRP price chart

Source: CoinMarketCap

Also Read | TAO Price Rebounds From Accumulation Zone: Is a Rally to $3,000 Imminent?

XRP Price Consolidation Signals Breakout Setup

On May 15,  2026, a popular crypto analyst, Xaif Crypto, noted that the price of XRP has continued to move sideways within a narrow range amid low but growing volumes. This type of behavior usually occurs ahead of a bigger move in the XRP price when it is “cooling down.”

XRP price chart

Source: Xaif Crypto’s X Post

According to the Xaif Crypto, the recent action of the XRP indicates that there is some stability in the price following the selling trend; therefore, there may be a formation of a temporary base within the market. This might lead the XRP to move from consolidation to expansion mode.

XRP Builds Cup Handle

Furthermore, another well-known analyst, ChartNerd, presented a longer-term analysis that showed how the cryptocurrency might be building a cup and handle formation for several years into the future. According to CharNerd, the larger trend is based on cyclical patterns of accumulation and distribution of the XRP price.

 XRP price chart

Source: ChartNerd’s X Post

In this case, the structure of the cup could have been formed already, whereas the handle formation might still be forming following the high reached by XRP in its preceding cycle. In this phase, XRP price may visit lower support levels, focusing on the $0.89 level, which corresponds to the 0.5 Fibonacci retracement zone.

The price action in history also reveals frequent retracements to similar levels in several cycles, suggesting that the XRP price tends to follow organized movements over extended periods, as opposed to random fluctuations. This trend has made some experts emphasize macrostructure over volatility.

In case the bullish continuation path holds, the Fibonacci extension charts reveal a possible long-term target above the present price, with calculations stretching up to $8 and more. Yet, it should be noted that such developments will depend entirely upon the maintenance of the structural strength of the XRP price.

Overall, at the moment, XRP is sitting at an important technical crossroads between short-term compression and long-term structural uncertainty, which means that the next important action will determine the path of the XRP price for the weeks and months ahead.

This article contains market analysis and price predictions. These are not guarantees. Crypto markets are volatile. Always DYOR. Not financial advice.

Also Read | SEI Price Analysis: Can Bulls Reclaim $0.10 After Long-Term Bearish Breakdown?

Filed Under: Cryptocurrency News

Dogecoin Price Could Rebound Toward $0.15 if Buyers Regain Momentum

By Zagham Abbas | Edited By Ammar Raza,May 16, 2026, 7:00 AM

Dogecoin price continued to be under selling pressure as the meme currency experienced a retracement after a bullish trend. Even though the DOGE faces some downward pressure, Dogecoin’s price is above an important support zone, implying that bulls are fighting for market dominance.

At the time of writing, DOGE is trading at $0.1117 with a 24-hour trading volume of $3.91 billion and a market capitalization of $17.26 billion. The DOGE posted a 1.46% down over the last 24 hours, reflecting reduced buying momentum after the recent rally.

DOGE price chart

Source: CoinMarketCap

Also Read | Ethereum Price Holds Above $2,300 as Institutional Demand Grows

Dogecoin Price Signals Bullish Breakout

As reported by a crypto analyst, BitGuru, DOGE appears to be ready for a bullish trend as it has spent many months consolidating within a tight price range. As per the analysis of the crypto expert, market sentiment is slowly coming back, which might help the coin reach $0.13 to $0.15 in the short term.

DOGE price chart

Source: BitGuru’s X Post

BitGuru also pointed out that the Dogecoin price is also beginning to generate higher support levels, which is typically associated with building confidence following a lengthy consolidation phase. While it appears that the bounce-back is slow, sustaining a price above the support region can help the bulls build more traction.

Dogecoin Price Signals Momentum Cooling

From an indicator point of view, it appears that the current price surge in the cryptocurrency Dogecoin will cool off shortly. This is seen through the RSI 14, which is currently trading at a value of 59.66, having earlier hit values close to 67, which indicated higher momentum in buying. Even though the value has dropped, it is still above the 50 value mark.

DOGE also remains above its 20-day moving average of $0.10853, maintaining a slight uptrend in the short term. Nonetheless, the price behavior shows that buying momentum is waning as investors are getting cautious about the present price.

DOGE technical indicator chart

Source: TradingView

Conversely, the MACD technical indicator continues trading at positive levels. At the moment, the MACD line is at 0.00385, with the signal line at 0.00388. Nonetheless, the histogram is now negative at -0.00003, signifying that the upward momentum may be fading following the latest rally.

In case of renewed demand, Dogecoin price might make a further push towards the critical $0.13 level. Conversely, any inability of the current level to hold might force the currency to consolidate around its levels or even move downward towards the $0.108 mark.

This article contains market analysis and price predictions. These are not guarantees. Crypto markets are volatile. Always DYOR. Not financial advice.

Also Read | Avalanche Price at $10.12 Surges Amid Avalanche Ecosystem Boom

Filed Under: Cryptocurrency News

Ethereum Price Weakens Short-Term but Long-Term Target Remains $5,000

By Zagham Abbas | Edited By Messam Raza,May 16, 2026, 6:00 AM

Ethereum price is under pressure in the short run due to increased selling and reduced momentum. Buying strength continues to fade even as some long-term perspectives see this area as a possible area for accumulation. It is time to keep an eye on critical support areas.

At the time of writing, Ethereum is trading at $2,226.86, with a 24-hour trading volume of $33.17 billion and a market capitalization of $268.45 billion. Over the last 24 hours, the Ethereum price has dropped by 3.74%, reflecting growing weakness in near-term buying strength across the market.

Source: CoinMarketCap

Also Read | Ethereum Price Holds Above $2,300 as Institutional Demand Grows

Ethereum Price Signals Weak Short-Term Control

On May 15, 2026, a crypto analyst, Crypto Patel, referred to the Ethereum rainbow chart, stating that the Ethereum price currently resides in what he terms as “a cheap zone.” The analyst explained that this is usually the position that is associated with fear on the part of many investors.

LOOK AT THE #ETHEREUM RAINBOW CHART RIGHT NOW

It's sitting in the "Cheap" zone.

I've been in this market long enough to know, this is the zone where most people are scared to buy, and that's exactly why it works.$ETH has only been here twice before. Both times, within 18… pic.twitter.com/HwCmJdalq3

— Crypto Patel (@CryptoPatel) May 15, 2026

And according to Patel, the Ethereum price was in this range only a couple of times previously. In both instances, the price action of ETH shifted towards the “take profit” range, which takes place roughly 18 months after an upward cycle starts.

His approach is to continue his accumulation process as long as the $2,000–$1,500 band remains intact. In case the price of Ethereum falls below this level, his choice will be slow accumulation rather than an emotional response. The future targets for the Ethereum price are set at $5,000, $10,000, and $15,000.

Momentum Indicators Show Cooling Ethereum Price Strength

Despite the long-term perspective, the short-term indications show that the ETH price is weakening. The Relative Strength Index indicator fell to 43.22, breaking through the crucial resistance at the 50 mark, indicating the decreasing buying interest while sellers have started becoming dominant.

Source: TradingView

MACD technical analysis is further confirmation of weak momentum. The MACD line is currently at -13.71, trading below the signal line of 0.52, and the histogram has now turned red. The change indicates weakening upside momentum for the Ethereum price and increased risks of declines ahead.

In case the trend persists, price action on Ethereum is likely to approach the 100-day MA near $2,145 as an important level for bulls to defend their position.

This article contains market analysis and price predictions. These are not guarantees. Crypto markets are volatile. Always DYOR. Not financial advice.

Also Read | SHIB Price Analysis: Falling Wedge Breakout Hints at 6x Move to $0.000030

Filed Under: Cryptocurrency News, Altcoin News

Cardano Price Holds $0.25 Support as Wealth Tech Forum Sparks Optimism

By Athulyamol VS | Edited By Messam Raza,May 16, 2026, 5:00 AM

Cardano is a blockchain platform using a research-based approach for the development of its smart contract ecosystem while focusing on scalability and governance, supporting the long-term Cardano price narrative. At press time, ADA was trading at around $0.26 with a slight increase over the past 24 hours.

Cardano Price Holds Above $0.25

The TradingView charts for the ADA token show the token maintaining its price within a narrow band while experiencing minor consolidation at the time, although price levels suggest buyers appear willing to defend the support at the recent low of $0.25 for the Cardano price.

From a technical indicator standpoint, the RSI remains neutral, indicating there is currently no overbought or oversold bias on ADA.

The moving averages have formed into a primarily flat configuration, indicating some degree of consolidation has occurred rather than producing any significant breakout trend. Trading volume is at moderate levels, indicating cautious participation in this market rather than aggressive buying of ADA.

Though there isn’t currently a significant breakout in terms of price levels, this provides short-term potential for further increases in the price of ADA based on the current trend line.

Cardano Price Holds Above $0.25
Source: TradingView

Also Read: ADA Price Analysis: Cardano Eyes $0.33 as $0.25 Support Holds

ADA Gains Visibility Following Wealth Tech Forum Mention

Attention was drawn to developments at the Wealth Tech Forum in the context of Cardano’s future wealth technology discussions and other developments.

Cardano Foundation shared a post that pointed out the addition of “Wealth Tech Forum” as an extension of the work Cardano has been doing to connect blockchain technology with financial technologies.

While the Wealth Tech Forum update did not appear to have a near-term price impact on ADA, the update may improve investor sentiment by drawing additional interest from institutional investors to the Cardano ecosystem.

The increased visibility created by institutional conversations with respect to the Cardano Ecosystem may promote a more stable environment for traders during periods of consolidation and may support the Cardano price outlook.

We are proud to sponsor the Wealth Tech Executive Forum hosted by @CV_Labs on 26 May in Zürich.

Sandro Knöpfel will give a keynote on how financial infrastructure is being rebuilt, and the role Cardano plays in that shift. pic.twitter.com/fU0wfEzEHy

— Cardano Foundation (@Cardano_CF) May 15, 2026

ADA’s price remains stable in the short term and is still holding just above major support levels despite ongoing uncertainty in the overall crypto market.

The additional interest generated by the Wealth Tech Forum on the overall progress of the Cardano Ecosystem and its future place in relation to the blockchain industry continues to provide support for its ecosystem growth and the development of investment opportunities within the Cardano Network.

However, the overall cryptocurrency market continues to be very volatile; therefore, ADA’s short-term pricing may be influenced by sentiment related to the larger cryptocurrency market.

This article contains market analysis and price predictions. These are not guarantees. Crypto markets are volatile. Always DYOR. Not financial advice.

Also Read: Cardano Price Faces Downside Risk Toward $0.145 Support Zone

Filed Under: Cryptocurrency News, Altcoin News

Hyperliquid (HYPE) Price Eyes $100 Target Amid Strong Bullish Momentum

By Tina Fatima | Edited By Ammar Raza,May 16, 2026, 4:30 AM

Hyperliquid (HYPE) price is consolidating near resistance while the market awaits breakout confirmation. Momentum indicators show stabilization, but price direction remains uncertain in the short term. Strong fundamentals and institutional activity continue to support a long-term bullish outlook despite current sideways movement.

HYPE Price Faces Key Resistance Zone

The chart shows HYPE price moving in a clear sideways range, with strong support near $25–30 and resistance around $45–50.

Price is currently testing resistance, making this a critical decision zone where traders expect either a breakout or another rejection soon.

If price breaks above $50 with strong volume and holds, it could trigger a bullish move toward $60–65 and potentially higher levels like $80–100, according to the crypto analyst 0xNeena.

HYPE price prediction chart
Source: @hami8040

This would confirm a range breakout and continuation, attracting more buyers and increasing overall market momentum.

However, if the price fails to break resistance and gets rejected, it may drop back toward $35 or even $30 support.

Traders should avoid entering at resistance and instead wait for either a confirmed breakout or a pullback for safer positions.

Also Read: HYPE Price Faces Pressure After Trendline Break: Is a Decline Coming?

Momentum Indicators Show Stabilizing Conditions

Indicators reflect a stabilizing momentum shift. The RSI is currently hovering around 57, indicating a bullish momentum.

It had fallen towards the 40s level but is now bouncing from the mid-level, which may indicate an increase in buying activity. It is still not in the overbought region, which means it can still move up.

HYPE TradingView Chart
Source: TradingView

The MACD indicator is starting to lose its bearish momentum as the histogram floats near zero, and the lines are converging.

The MACD indicator line lies just below or touches the signal line, indicating indecision as well as a possible turn. This suggests that the previous downward momentum of the stock price is stabilizing.

Institutional Expansion and Long-Term Fundamentals

Fundamentals continue supporting the expansion trend. The $BHYP tokens have commenced trading on the NYSE market as a sign of a landmark event in realizing significant Hyperliquid exposure.

The blockchain is already processing about $4.4 trillion worth of perpetual volume, managing up to 200,000 orders per second, and offering access to over 130 perpetual futures products in the equities, commodities, and FX markets.

HYPE price analysis shows strong long-term momentum, driven by a strong underlying protocol foundation.

As one of the 10 largest cryptocurrencies, with a market cap of $11 billion, and having risen in ranking to become one of the 10 largest cryptos within less than two years, the cryptocurrency benefits from its 99% revenue payout through buybacks and burns.

This article contains market analysis and price predictions. These are not guarantees. Crypto markets are volatile. Always DYOR. Not financial advice.

Also Read: Hyperliquid ETF Debuts on Nasdaq With $1.2M First-Day Inflows


Filed Under: Altcoin News

Solana Price Targets $100 After Massive Adoption Boost

By Athulyamol VS | Edited By Messam Raza,May 16, 2026, 4:00 AM

Solana price has gained momentum this month due to recent institutional developments and positive technical indicators, as traders await a potential breakout toward the $100 price range.

The SOL network focuses on providing rapid and low-cost transaction capabilities while also providing infrastructure for decentralized apps (dApps) and institutional-grade financial products such as tokenized funds and asset management solutions. At press time, Solana price is trading at around $89 with an increase of nearly 3% over the past 24 hours.

Chart Suggests Solana Could Test $100

According to the data from TradingView, Solana’s price continues to consolidate near current levels at the time of writing. SOL found support near the $82 mark earlier this month before bouncing back toward the $90-$92 range, making this an area of key interest to traders watching for a breakout confirmation.

The MACD remains bullish with both signal lines trending upward, indicating that momentum continues strengthening for Solana price.

OBV has also risen alongside price, suggesting that buying pressure is improving, but SOL must receive stronger volume confirmation above key resistance levels before a continuing rally can be confirmed.

Chart Suggests Solana Could Test $100
Source: TradingView

Market Confidence Supported by Solana Price Institutional Update

Solana recently announced via the X platform growing institutional adoption with a post noting that Amundi (Europe’s largest asset manager with €2.4T AUM) and Spiko are set to launch a UCITS fund on Solana.

This news highlights the ongoing institutional adoption of Solana’s ecosystem and the growing demand for real-world asset (RWA) infrastructure.

It also aligns with the recent increase in Solana price action, as institutional developments often strengthen the long-term investment thesis and improve overall market sentiment.

BREAKING: @Amundi_ENG, Europe's largest asset manager (€2.4T AUM) and @Spiko_finance ($1.7B AUM) are launching a UCITS fund on @Solana pic.twitter.com/T0qa5jWWkc

— Solana (@solana) May 15, 2026

Also Read: Solana Price Holds Key $90 Support and $96 Resistance Limits Breakout Momentum

Monthly Returns Chart Shows Optimistic Outlook for Solana Price

The monthly returns heatmap from Cryptorank shows strong historical May performance for Solana, with most bullish cycles often recording gains of more than 30% in previous years. So far, May is on track to provide positive results for 2026 and support the continued recovery in Solana price.

Monthly Returns Chart Shows Optimistic Outlook for Solana Price
Source: Cryptorank

SOL is showing increasing strength and momentum, although several key resistance levels will likely need to be tested before SOL’s price can move toward new highs or build stronger bullish momentum. The cryptocurrency market remains highly speculative, making it an extremely volatile environment.

This article contains market analysis and price predictions. These are not guarantees. Crypto markets are volatile. Always DYOR. Not financial advice.

Also Read: Solana Price Range Tightens as $98 Breakout Could Trigger $107–$117 Rally

Filed Under: Solana (SOL), Cryptocurrency News

Hyperbridge Protocol Offers $50,000 Bug Bounty Following Bridge Exploit

By Arslan Tabish | Edited By Messam Raza,May 16, 2026, 3:00 AM

Hyperbridge Protocol has opened a public bug bounty on HackenProof, offering up to $50,000 for critical vulnerabilities. The program invites security researchers to inspect its public codebase after an April exploit exposed weaknesses in its cross-chain gateway and message verification.

As per the report, the HackenProof listing shows the Hyperbridge Protocol program is live and active. It explains that Hyperbridge is a cross-chain communication system that relies on consensus and state proofs rather than the previous cross-chain bridge structure of multisig committees.

Also Read: Bitwise Launches Hyperliquid ETF with Native Staking

Hyperbridge Protocol Bounty Targets Critical Bridge Flaws

The severity determines the reward payments. The range of low severity reports begins at $200, and medium severity ranges from $2,000 to $5,000. Vulnerabilities rated as “high risk” are eligible for $5,000 to $15,000. Critical reports can earn up to $50,000.

It includes the entire Hyperbridge protocol repository. Researchers can report logic flaws, access-control failures, reentrancy, cross-chain message spoofing, state manipulation, and any bug that might impact message integrity or the safety of the funds.

The new review follows an April attack on the Hyperbridge Protocol gateway. An attacker minted about 1 billion fake DOT-equivalent tokens on Ethereum through a forged cross-chain message. With admin access, the attacker was able to steal approximately $237,000 worth of Ether.

The fake token supply impacted the bridged representation of DOT. The earlier report indicated that the native network technically had no effect on Polkadot. The incident also demonstrates the risks of bridges created due to weak verification checks and forged messages.

Source: Hyperbridge

HackenProof Rules Require Proof-of-Concept Reports

Hyperbridge has placed limits on testing activity. Local forks are the only ones allowed for use in research. The project does not include attacks on live infrastructure, social engineering, third-party exploits, spam, DDoS testing, service disruption, or access to personal data.

The HackenProof page also requires proof-of-concept submissions. Reports that are only theoretical will not be accepted. Researchers must stay within the listed scope and avoid public disclosure unless approval is given.

Hyperbridge Protocol had drawn media attention before the April incident. Enjin Blockchain created Hyperbridge on testnet to facilitate cross-chain stablecoin transfers between Ethereum and BNB Chain, using USDC and USDT stablecoins.

The previous configuration demonstrated the need for bridge security. Users mint tokens on one chain and get a corresponding token on another network. If proof checks fail, one contract issue can spread across a cross-chain system.

The bug bounty program expands the scope of the Hyperbridge Protocol codebase for review. The program provides researchers with a channel to report on the project’s efforts to decrease the incidence of repeat failures and enhance security measures.

Also Read: THORChain Hack Drains $10M+ as RUNE Drops 10%: ZachXBT

Filed Under: Cryptocurrency News

VIRTUAL Price Forecast: Can Bulls Reclaim $0.80–$0.82 for Further Upside?

By Tina Fatima | Edited By Messam Raza,May 16, 2026, 2:30 AM

VIRTUAL price remains in a rising channel after rebounding from February lows, holding key support level. RSI and MACD indicate weakening momentum, suggesting caution in the short term. However, XRPL agent commerce expansion continues to support long-term sentiment and strengthens adoption potential across the Virtuals ecosystem.

VIRTUAL Price Holds Rising Channel Structure

The 12-hour VIRTUAL price chart shows the asset trading within a rising channel after rebounding from February lows.

Market structure of virtual price remains bullish overall, with buyers defending the critical $0.74–0.78 support zone. Multiple higher lows and rounded-bottom formations indicate gradual accumulation across recent trading sessions.

The recent rally toward $0.95 faced rejection, triggering a pullback into Fibonacci and moving-average support.

VIRTUAL price prediction chart
Source: @Crypto_Scient

The 0.786 retracement near $0.75 currently acts as the strongest defense area, while reclaiming the 0.618 level around $0.80–0.82 could confirm renewed bullish continuation toward higher resistance zones.

If bullish momentum returns, VIRTUAL price may target $0.95, $1.05, and eventually the upper ascending channel near $1.30–1.40, according to the crypto analyst Scient.

However, losing the $0.74 support and breaking below the rising trendline would weaken the structure, exposing downside risks toward $0.68 and potentially the broader $0.60 support region.

Also Read: VIRTUAL Holds $0.67 Support: Can Buyers Spark a $0.80 Recovery Rally?

RSI and MACD Signal Weakening Momentum

From an indicator perspective, the RSI dipped to 46.25 following a near touch with the overbought level of 80, suggesting weak bullish strength on the daily chart.

The moving average of the RSI is at 64.02, revealing a decline in buying strength. The decrease implies a shift to a more cautious stance by the traders.

Source: TradingView

MACD is now showing bearish signs; the MACD line has dropped below the signal line to stand at 0.02802, while the signal line stands at 0.03863.

The histogram has also turned negative to read -0.01061 as an indication that there is reduced momentum in the upwards direction.

XRPL Expansion Brings Attention to Virtuals

Despite the price action, Virtuals are gaining attention as agent commerce expands into the XRPL ecosystem.

Discussions on the Virtuals Protocol-XRPL collaboration at XRP Las Vegas pointed towards a world where autonomous agents will soon perform transactions directly through merchant services using blockchain technology.

This advancement can further boost the bullish sentiment in Virtuals with the increasing adoption of AI-backed blockchain technology.

An increase in real-world applications, automated transactions, and new economic participants can fuel activity within the XRPL ecosystem.

If there is steady growth in adoption, Virtuals may generate more investor interest along with crypto technology developments.

This article contains market analysis and price predictions. These are not guarantees. Crypto markets are volatile. Always DYOR. Not financial advice.

Also Read: VIRTUAL Bullish Setup and Rising Open Interest Point to a Rally Toward $0.90

Filed Under: Altcoin News, Cryptocurrency News

Hyperliquid (HYPE) Adds $2 Billion Market Cap in 24 Hours

By Amrin Sanjay | Edited By Ammar Raza,May 16, 2026, 2:00 AM

Hyperliquid’s native token HYPE recorded a sharp rally over the past 24 hours, adding nearly $2 billion to its market capitalization as renewed investor interest flowed into the decentralized trading ecosystem. The surge came after Coinbase announced expanded support for Hyperliquid’s USDC infrastructure, a move that many market participants viewed as a major validation of the platform’s growing role in decentralized finance.

HYPE pumped +23% in the last 24 hours, adding $2 BILLION to its market cap.

Why it's pumping:

– Coinbase just became the official USDC deployer on Hyperliquid
– The $5 billion in USDC on Hyperliquid earns 3.5-4% yield. That's around $200M a year.
– That increases Hyperliquid's… pic.twitter.com/5QkTtRUI68

— Ash Crypto (@AshCrypto) May 15, 2026

Coinbase Partnership Boosts Hyperliquid Ecosystem

The latest rally in HYPE followed Coinbase’s decision to become the official treasury deployer of USDC on Hyperliquid through the AQAv2 upgrade framework.

Circle will continue serving as the technical deployer responsible for cross-chain infrastructure and the Cross-Chain Transfer Protocol (CCTP). The announcement strengthened confidence in Hyperliquid’s long-term stablecoin liquidity strategy.

Coinbase partnership boosts Hyperliquid ecosystem
Source: Binance

Market participants reacted positively because the integration aims to make USDC the primary quote asset across future canonical markets on HYPE. This reduces fragmentation between stablecoin liquidity pools and creates a more unified trading environment for users and developers. Investors often view streamlined liquidity systems as beneficial for platform efficiency and long-term adoption.

Also Read: Kraken Selects Chainlink CCIP for Cross-Chain kBTC

HYPE Price Rally Adds Billions in Market Value

According to market data shared across crypto trading platforms, HYPE gained more than 23% within a single day. The price increase pushed billions of dollars into the token’s overall market capitalization, making it one of the stronger-performing altcoins during the session. Trading activity also rose significantly as traders rotated capital into the token.

Analysts linked the rally to growing expectations that Hyperliquid’s ecosystem revenue could increase through higher USDC utilization.

Some community estimates suggest that billions of dollars worth of USDC on the network may generate additional yield opportunities for the protocol. Investors also focused on HYPE’s revenue-sharing and token buyback structure, which has become a major talking point surrounding HYPE’s valuation.

USDC Integration Seen as Key Revenue Driver

The AQAv2 framework is designed to align USDC liquidity more closely with Hyperliquid’s protocol structure. Under the arrangement, Coinbase is expected to share a significant portion of reserve yield revenue with the protocol. This model could potentially strengthen Hyperliquid’s treasury and support ecosystem growth over time.

Another important aspect of the transition is the gradual sunset of USDH, a stablecoin previously integrated into the Hyperliquid ecosystem.

While USDH remains fully backed and operational, the platform plans to shift focus toward USDC-based liquidity infrastructure. Developers and market participants have argued that consolidating liquidity around a single major stablecoin can improve user experience and reduce market inefficiencies.

Growing Attention on Fundamental Altcoin Projects

The HYPE rally also reflects broader market interest in altcoins with active revenue models and expanding infrastructure partnerships. In recent months, investors have shown stronger interest in blockchain projects that generate measurable ecosystem activity rather than relying solely on speculation. Hyperliquid’s trading volumes and protocol revenue have contributed to that narrative.

The partnership with Coinbase additionally provides Hyperliquid with increased visibility among institutional and retail crypto users. Coinbase remains one of the largest crypto exchanges globally, and its involvement often draws attention to projects integrated into its ecosystem.

While volatility remains high across digital assets, the latest developments positioned Hyperliquid as one of the most closely watched DeFi-related tokens in the market.

Also Read: Chainlink Price Prediction: Can LINK Price Break $15 After Strong Recovery?

Filed Under: Altcoin News, Cryptocurrency News

  • « Go to Previous Page
  • Page 1
  • Interim pages omitted …
  • Page 67
  • Page 68
  • Page 69
  • Page 70
  • Page 71
  • Interim pages omitted …
  • Page 3666
  • Go to Next Page »

Primary Sidebar

Recent Posts

  • ALGO Price Forecast: Can it Break Above $0.1319 Resistance? June 6, 2026
  • XRP Price Struggles at $1 Support While Bullish Cycle Targets Stay Locked at $5, $10 June 6, 2026
  • Galaxy Research Warns CLARITY Act Could Face Major Delays in 2026 June 6, 2026
  • Binance Coin Price Holds $570 as Resistance Triggers Market Uncertainty June 6, 2026
  • Professional Bitcoin Holdings Fall 17% as Hedge Funds Exit Positions June 6, 2026

Footer

News

  • Latest News
  • Altcoin News
  • Bitcoin (BTC)
  • Blockchain
  • Tron (TRX)
  • World

Digest

  • Meet the Founder
  • Price Winning Article
  • DeFi
  • Cyber Security
  • Crypto Scam

Industry

  • Project Review
  • Technology
  • Fintech
  • Tron Exchange
  • New in Town

Tron Universe

  • Event and Tron Parties
  • New in Town
  • Tron Tokens

FOLLOW US

  • Facebook
  • Telegram
  • Twitter
  • Linkedin

Subscribe US

Editorial Policy | Privacy Policy | Disclaimer | Terms and Conditions | Masthead

Copyright © 2026 · Tron Weekly. All Rights Reserved. NOTE: Tron Weekly is an independent crypto news site that adheres to the strict journalism policy anchored on transparency, trust, and objectivity, we have no affiliation with the TRON Foundation, its founder Justin Sun or any other cryptocurrency firm.