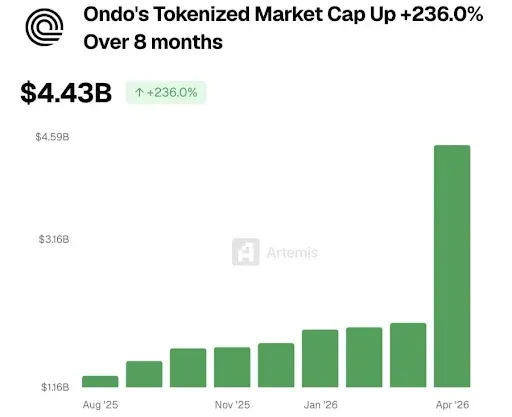
ONDO price is gaining attention after Niels pointed out a rapid increase in tokenized market value. In just one month, the project added $2 billion, lifting total assets from $1.18 billion to over $4.4 billion within eight months.
The consistent increase signifies a growing trend towards the tokenization of tangible assets as well as a growing involvement of major stakeholders in on-chain financing.
Source: X
The consistent inflow indicates that the price of ONDO has gone beyond estimates and reached the stage of adoption where the larger stakeholders are participating.
According to market observers, such trends of growth come into being when the newly established financial system begins to develop trustworthiness and liquidity among both retail customers and institutional investors.
Also Read: XRP Price Breakout Above $1.56 Could Trigger Strong Upside Rally Move
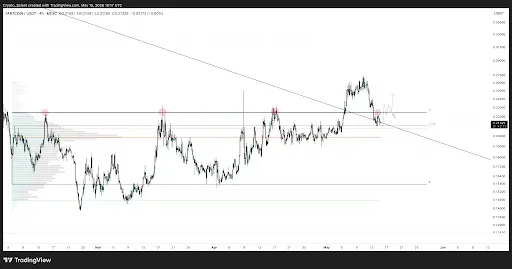
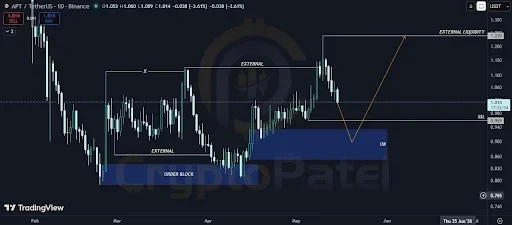
ONDO Price Breakout Structure and Technical Levels
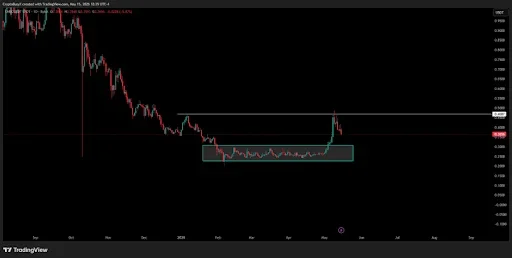
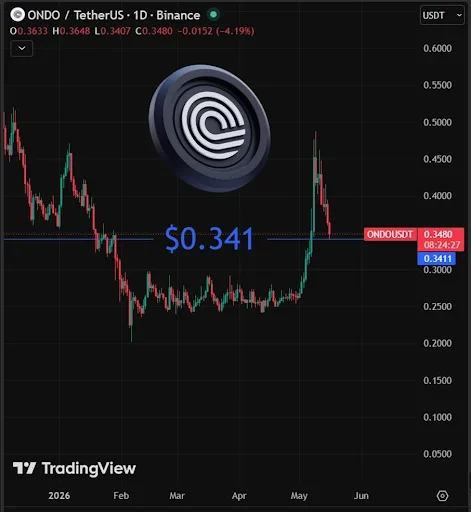
The price pattern indicates that the ONDO price has made a breakout from its lengthy period of multi-month consolidation at $0.26 to $0.30.
Such a breakout can signal that the accumulation process might be complete and buyers have started gaining control after an extensive selling period.
The ONDO price has been subjected to heavy resistance at $0.95, which resulted in a long downtrend until it eventually stabilized in a narrow range.
Source: X
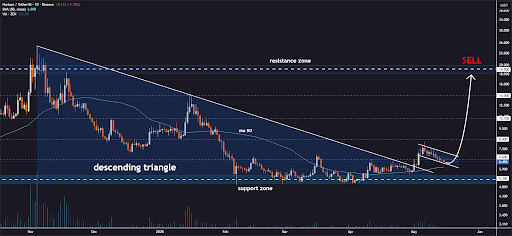
The traders are now focusing on the area between $0.45 and $0.48 as the key level. The ONDO price can either maintain its uptrend from here onwards, or it can be rejected yet again.
As long as the price manages to remain above the previous high at $0.30-$0.31, the chart points towards an ongoing uptrend until the next resistance zones. However, if the price fails to hold above these zones, a drop back to the previously traded range is imminent.
Liquidity, Heat, and Market Positioning
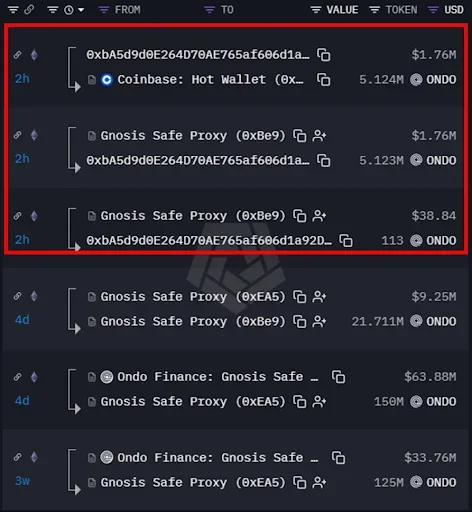
The recent blockchain activity reported by Nazoku reveals that a wallet linked to Ondo Finance transferred 5.12 million ONDO (roughly equivalent to $1.76 million) to Coinbase. This is causing traders to be wary for the near future.
Source: X
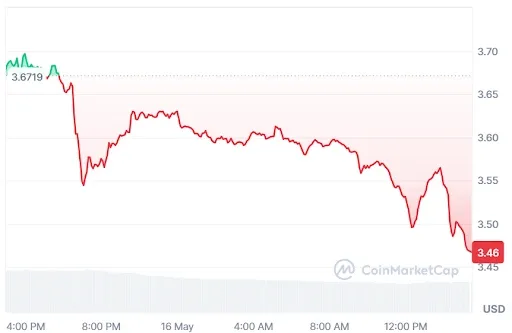
Currently, the ONDO price sits close to the $0.34 support line, and the liquidity heat map reveals clusters on both buy and sell sides.
There is a $30 million liquidation pool close to $0.337, while there is a $24 million cluster close to $0.35. This makes for a small region that will experience volatility.
Source: X
The market makers and traders who use leverage find themselves in a delicate position, such that small price changes may cause substantial liquidations from either side. It results in sudden price spikes as it tries to eliminate liquidity to form a trend.
This article contains market analysis and price predictions. These are not guarantees. Crypto markets are volatile. Always DYOR. Not financial advice.
Also Read: DASH Price Could Surge Toward $143 if Bulls Maintain Key Support Level