Ethena price is currently showing a market structure that combines both negative and positive elements, wherein the immediate weakness has to be viewed against the possibility of a technical breakout at higher time frames.
Though there have been fewer trades in recent days and less participation in the markets, there have been some signs of a change in momentum developing through chart patterns.
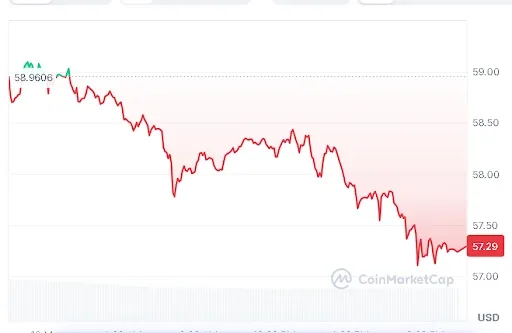
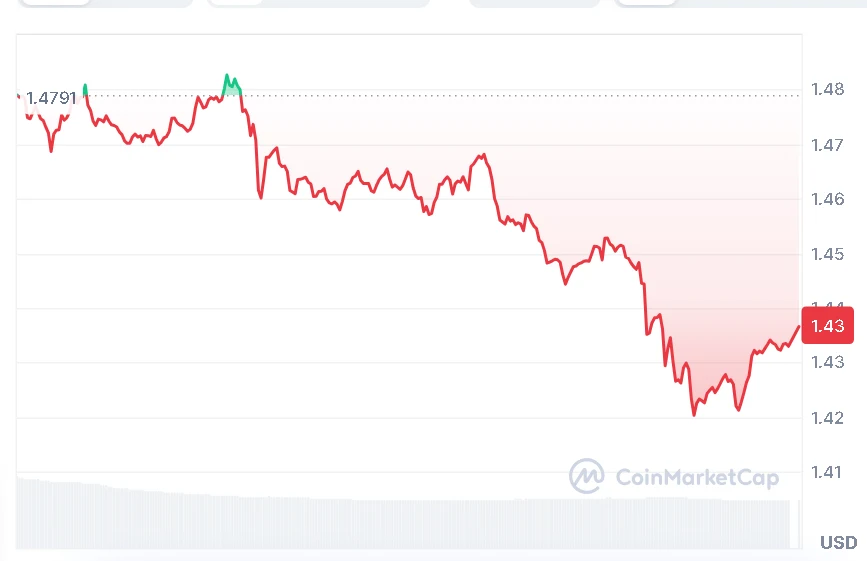
At the time of writing, ENA is trading at $0.1212, marking a 6.93% decline over the last 24 hours. The Ethena price has come under pressure as selling activity continues in the spot market, while trading volume remains elevated at around $230.30 million. Despite the downturn, the broader market structure is showing early signs that the bearish phase may be losing intensity.

Source: CoinMarketCap
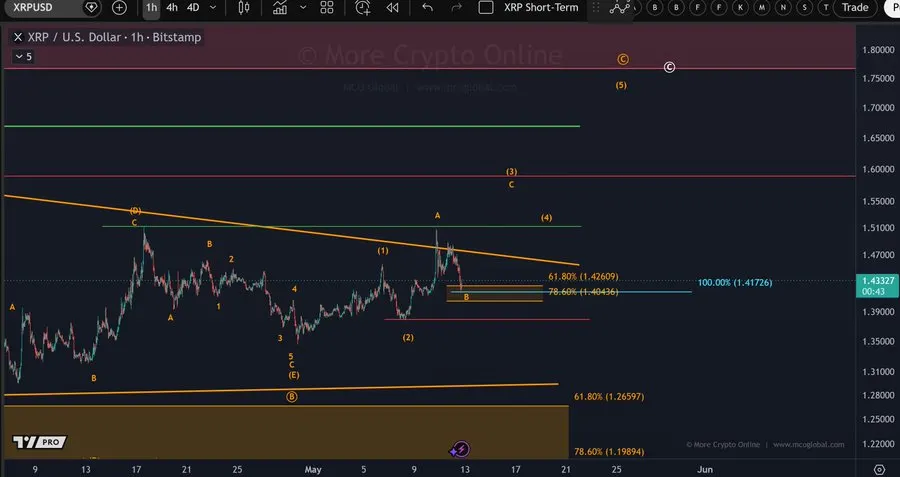
Also Read | XRP Price Analysis: Can XRP Reclaim $1.49 Resistance?
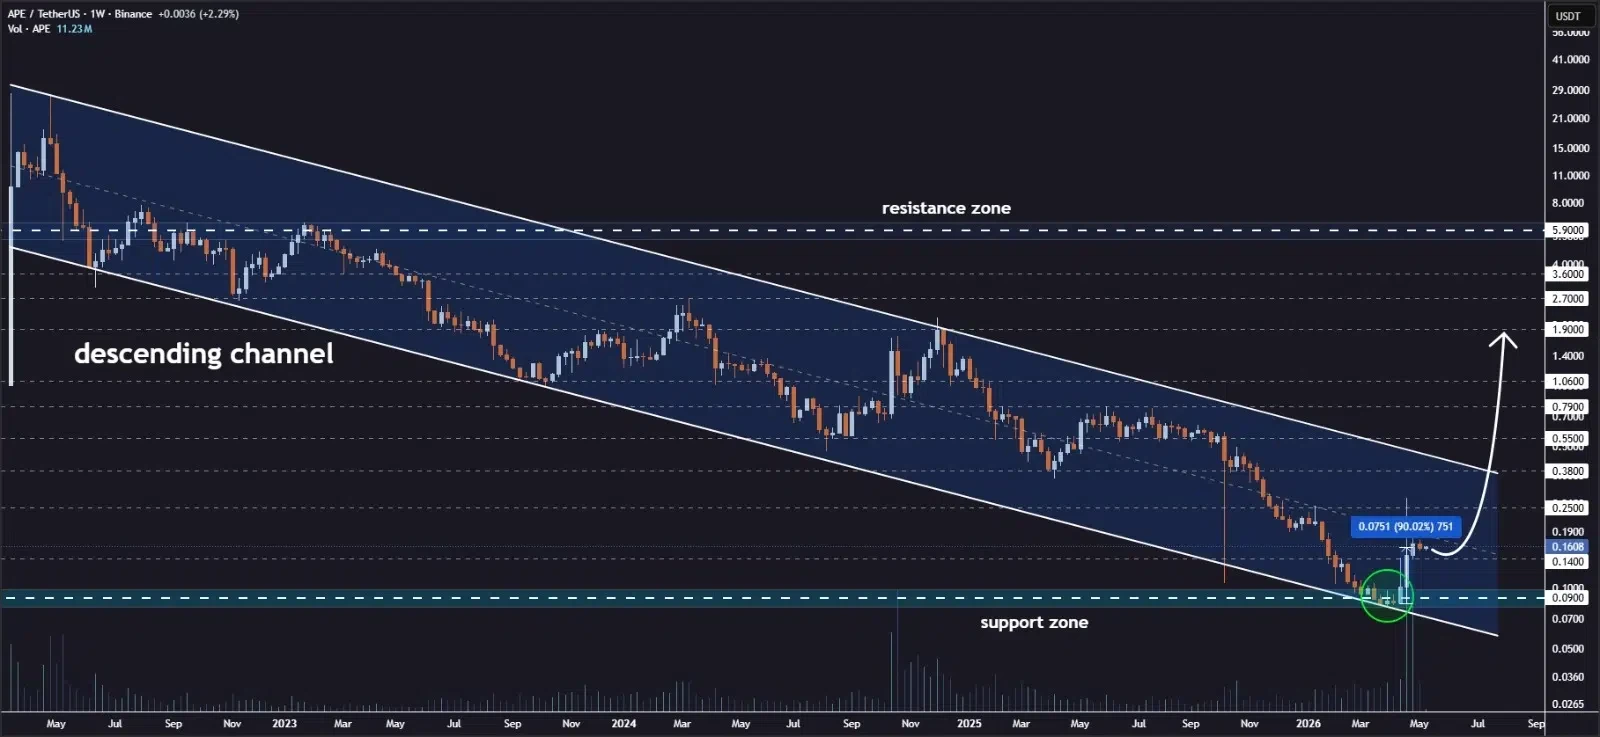
Ethena Price Breakout Hints Reversal
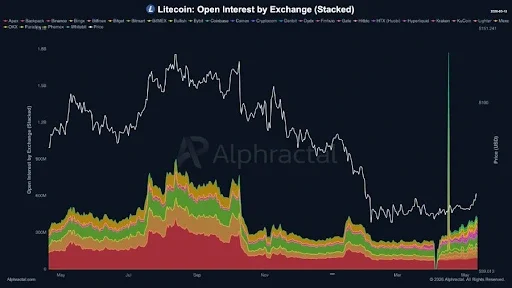
From a technical point of view, Ethena’s price has been in focus lately following a mention by popular crypto analyst Butterfly of a bullish formation that was spotted on the 3-day timeframe. The technical review provides further context.

Source: Butterfly’s X Post
Butterfly noted that ENA has made a breakout from the descending channel boundary, suggesting that bearish power is waning. A further increase in strength could see the token rally up to $0.80.
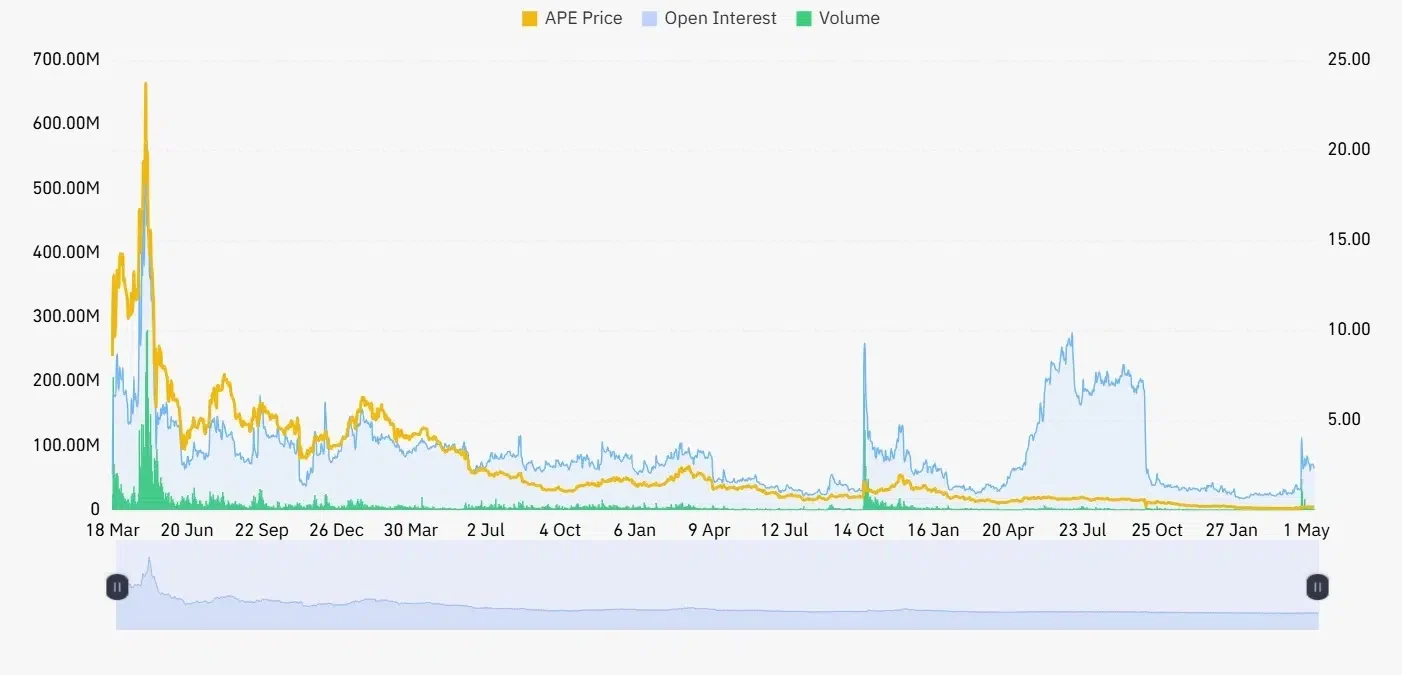
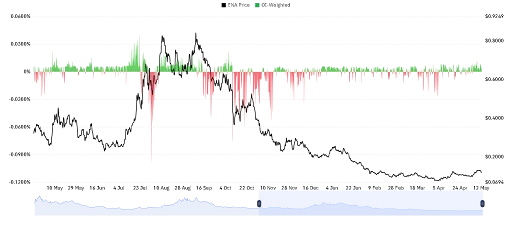
Ethena Derivatives Signal Weakness
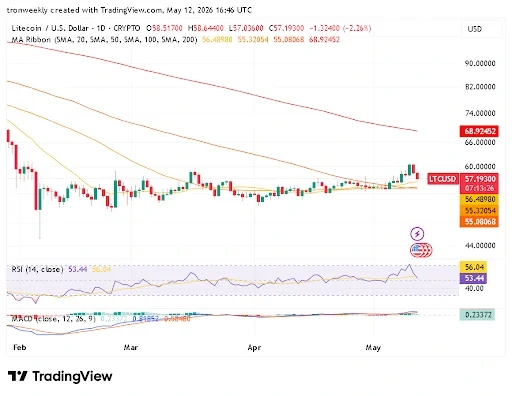
On the derivative side, lower participation also indicates reluctance on the part of investors. The open interest has fallen by 10.43% to $232.93 million, while the futures contract turnover has decreased by 23.68% to $351.91 million. Such a fall reveals decreased speculative positions on the Ethena price, implying that most market participants are awaiting a clear direction.

Source: Coinglass
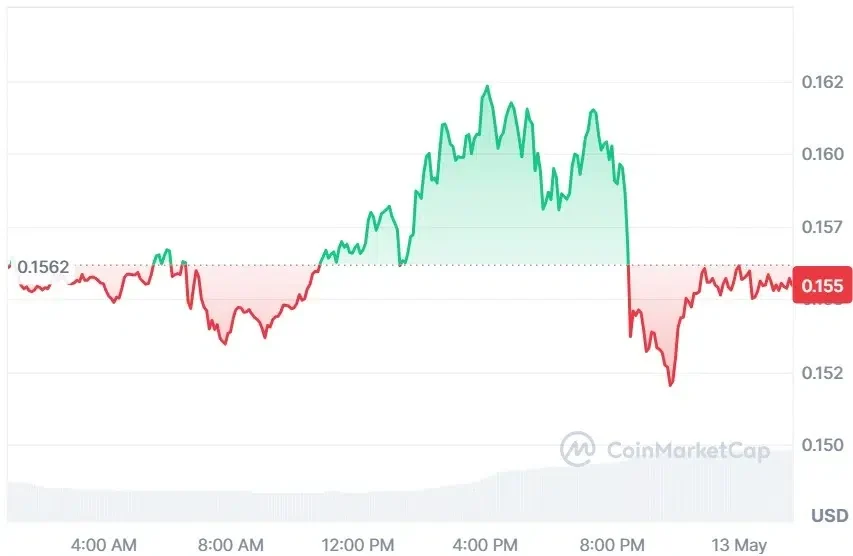
The financing terms are rather impartial since the OI-weighted financing rate equals 0.0036%. The neutrality demonstrated by the terms reflects the fact that investors don’t have either a bullish or a bearish sentiment toward the Ethena price, confirming the transitional state of the market.
Source: Coinglass
Overall, there is short-term pressure on the performance of Ethena shares, but the latest breakout formation keeps attention on whether the share price will sustain its momentum going forward.
This article contains market analysis and price predictions. These are not guarantees. Crypto markets are volatile. Always DYOR. Not financial advice.
Also Read | SHIB Price Ascending Triangle Signals Rally Toward $0.00000760 Resistance Ahead