Injective (INJ) is testing a long-term support zone that previously led to strong rallies, while technical indicators show early bullish momentum for the Injective price. Rising network activity and record user growth suggest stronger adoption, placing the asset at a key point where it may either continue its uptrend or weaken.
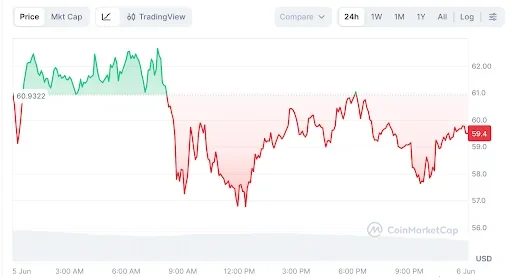
At the time of writing, INJ is trading at $5.10 with a 24-hour trading volume of $133.35 million and a market capitalization of $510.5 million. Despite the signs of stability over the last 24 hours, the question is whether the INJ price structure and network growth could lead to new highs.

Source: CoinMarketCap
Injective Price Suggests Possible Run Toward $50+
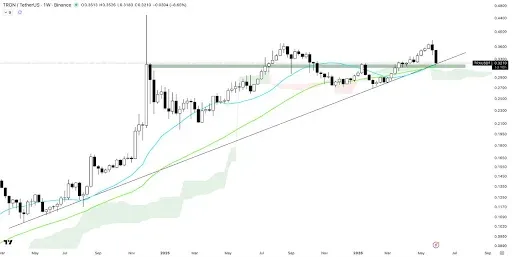
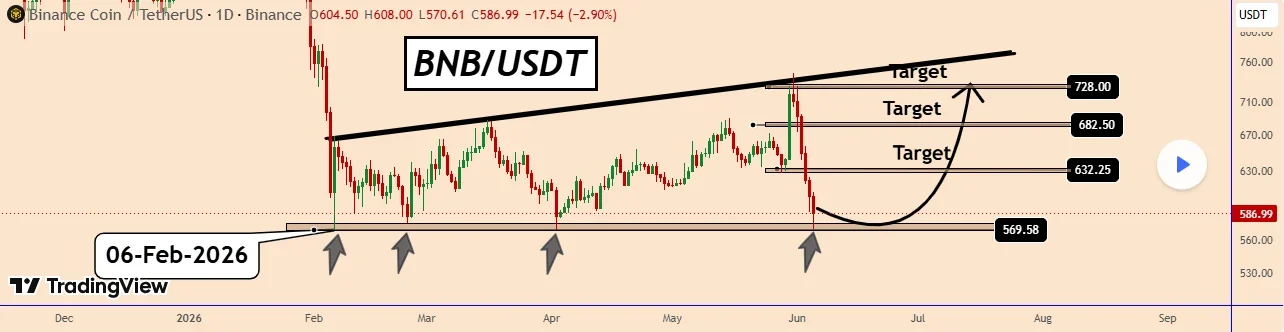
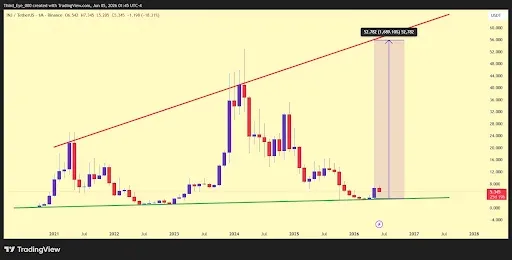
According to the crypto analyst Third Eye, the Injective price has been retracing back to another very important long-term macro trendline, which it has hit near the price of $5.30, representing a strong accumulation zone in history.
Past encounters with this level were followed by some very explosive moves upwards over 1,000%, making for a strong bullish case around this trendline.
Source: Third Eye’s X Post
The question on everyone’s mind is if the pattern continues. Optimists predict a return to the $40-$50+ range based on this historical repeat.
However, there are others who believe that the cycle in markets could render previous performance obsolete. The Injective price now stands at an important crossroads, and depending on whether growth or failure occurs, it will be clear what the future holds.
Also Read: Injective (INJ) Price Analysis: Elliott Wave Structure Points Toward $13.17
MACD Bullish Crossover Point to Improving Sentiment
According to TradingView, the Injective price is characterized by a bearish macrocycle, as it drops from its high point at $34.00 to the crucial low point of $2.50. Yet, there is a very strong bullish turnaround going on in the process.
The Injective price has crossed over the 3.71374 midline of the moving average and reached the 5.65183 Bollinger Band with the closing price at 5.09840.

Source: TradingView
The momentum indicators further support this structural shift in trend for the Injective price. The blue line on the MACD indicator has decisively moved above the orange signal line from -1.03891 to -0.45820.
However, the histogram indicator is printing positive green candles at 0.58071 amid expansion. Furthermore, the Injective price is experiencing a breakout from its accumulation stage as the lower band rises to 1.77565.
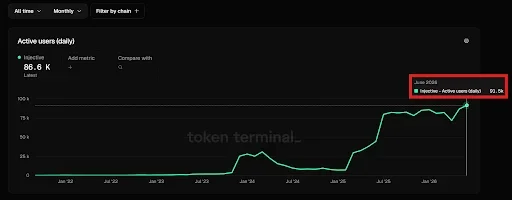
Injective Hits Record 91.5K Daily Active Users
The data from Everstake further highlighted that the ecosystem momentum in Injective continues to be strong, especially considering that the platform has surpassed 91,500 daily active users, setting another record.
Month-over-month growth has been evident through increased participation on the platform’s DeFi ecosystem. This can be attributed to increasing app usage, development, and financial activity on-chain.
Source: Everstake’s X Post
Injective’s increase in usage comes through sustained growth, instead of peaks, indicating consistent demand for Injective’s top-notch trading and decentralized finance infrastructure.
Higher utilization by builders, validators, and end-users has resulted in further network effects. As the network becomes larger, it matures to become a fully functional liquidity-based on-chain financial system.
This article contains market analysis and price predictions. These are not guarantees. Crypto markets are volatile. Always DYOR. Not financial advice.
Also Read: Injective Price Falls 17% After Major Support Break, More Downside Ahead?