• Skip to primary navigation
  • Skip to main content
  • Skip to primary sidebar
  • Skip to footer
  • About TronWeekly
  • Write for us
  • Terms and Conditions
  • Privacy Policy
  • Disclaimer
  • Contact
  • All Posts
  • Advertise

TronWeekly

Crypto World News

  • Home
  • Latest News
  • Opinion
    • Education
    • Best TRON Wallets
    • Beginner’s guide to TRON
    • Tron Tokens
    • Market Analysis
  • Industry
    • Tron Exchange
    • Project Review
  • Press Release
  • Bitcoin (BTC)
  • Ripple (XRP)
  • Advertise
  • About TronWeekly
    • The Team
    • Editorial Policy
    • Write for us
    • Privacy Policy
    • Disclaimer
    • Terms and Conditions
    • Contact
You are here: Home / All Posts

All Posts

SUI Price Forecast: Market Cap Model Suggests Long-Term Upside Toward $71 Billion

By Sajjal Ali | Edited By Messam Raza,June 7, 2026, 7:00 AM

SUI price is drawing fresh attention after falling into a major support zone that previously acted as a strong demand area. According to market watcher BitGuru, the SUI price has reached a key level after a long bearish trend.

This is very significant since the market will be on the lookout for possible signs of reversal. At this point, the coin is already testing out a price region that has seen previous buying activity from bulls.

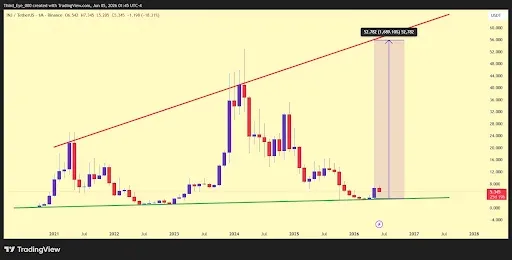
SUI Price Reaches Critical Support After Extended Decline

Through chart analysis, the market can be said to be undergoing a complete cycle. This cycle began with an extended consolidation stage followed by a powerful bullish breakout.

During the initial stages, there was very little movement in price while buyers were gradually accumulating sellers’ positions.
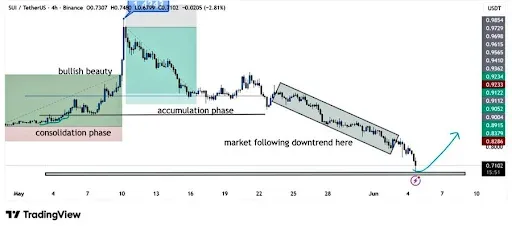
SUI Price chart

Source: X

After a good rally followed by some consolidation, the bulls lost steam, and the trend began moving downwards, which was characterized by lower lows and lower highs, indicating dominance on the part of the bears.

This decline took place within a downtrending channel, suggesting that there is a gradual distribution of shares as opposed to a panic sell-off.

There is currently support for the SUI price at $0.71, where buyers need to see either higher lows, increased volume, bullish candles, or even a breakout of the upper channel boundary.

Also Read: Hyperliquid Price Crashes to $56: Is HYPE’s Rally Over or Just Pausing?

Market Cap Structure Points to Larger Recovery Scenario

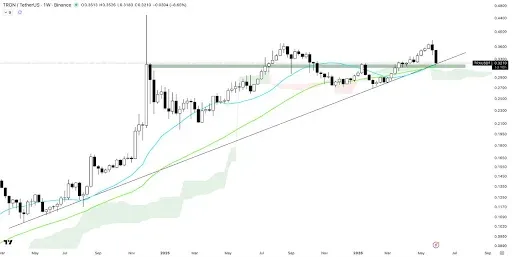
Analyst Vuori Trading’s analysis highlights that there is a bigger picture for Sui apart from support in the short-term charts. From the chart, the Sui price is currently at the point where previous declines were halted by fresh buying interest.

One of the important areas of support is around $2.17 billion in market cap. The prediction indicates that we may be revisiting this level before a potential bounce occurs. If the buyers manage to defend this level, then the next potential resistance levels would be around $7.85 billion, $11.3 billion, and $17 billion.

Market Cap Structure Points to Larger Recovery Scenario

Source: X

Long-Term Targets Extend Toward $71 Billion

In terms of the long-term outlook, increased objectives would be expected if the positive trend continues. The Fibonacci extension levels provide targets for the market cap at $26.16 billion and $40.97 billion.

Under favorable conditions during a prolonged bullish rally, the Sui price might climb to $72.75 billion, thus becoming one of the most prominent blockchains in the world. On the other hand, the momentum oscillators are still close to the lowest levels due to the recent pullback.

This article contains market analysis and price predictions. These are not guarantees. Crypto markets are volatile. Always DYOR. Not financial advice.

Also Read: Binance Coin Price Holds $570 as Resistance Triggers Market Uncertainty

Filed Under: Cryptocurrency News, Altcoin News

Ethereum Transfer of $121 Million From Joseph Lubin-Linked Wallet Sparks Market Speculation

By Zagham Abbas | Edited By Messam Raza,June 7, 2026, 6:00 AM

The massive Ethereum Transfer from a wallet connected to an account of Ethereum co-founder Joseph Lubin has garnered great interest in the entire cryptocurrency community after being inactive for more than three years.

According to on-chain data from Lookonchain,  the wallet has sent 80,001 ETH, which translates to about $121.6 million, thus resulting in a huge Ethereum transfer, which instantly created curiosity over whether the move was intentional or not. It should be noted that the wallet still has most of its holdings remaining intact after the transfer.

Ethereum Transfer

Source: Lookonchain’s X Post

Also Read | SpaceX and Google $920M AI deal reshapes global compute market

Ethereum Transfer Fuels Selloff Concerns

The latest Ethertium transfer was done through a wallet address that contains approximately 243,300 ETH, worth $370 million in value post-transaction. However, despite having transacted a huge portion, there is still about 75% of funds left idle, which suggests more of a portfolio restructuring than an outright liquidation.

The reason behind this controversy is that Ethertum transfer, when it is big, always comes into the limelight, especially in times when the market is fragile. However, as to the location to which this money will go, no details have been revealed as yet.

It gets even trickier with Ethereum facing selling pressure. Over the past week, Ethereum has declined by nearly 23%, at the time of writing, ETH is trading at $1563.26. There has also been some increase in trading, with its 24-hour volume up by 5.41% to $30.92 billion.

Ethereum Transfer Fuels Selloff Concerns

Source: CoinMarketCap

Ethereum Transfer Highlights ETH Weakness

Market experts are keeping an eye on whether the Ethereum transfer will put more pressure on the market in the short term. Ethereum is still lagging behind its all-time high by almost 68%, and yearly losses have reached around 47%.

Technical indicators, including the bearish pennant formation pattern, have also been analyzed. In case of a breakdown of key support levels, there is a possibility that ETH may move into the $800-$900 region. Though unverified, Ethertium transfer has increased concern among investors.

This is not the first time that previously inactive wallets have shown life. In previous waves, some large wallets would move funds to exchanges, whereas others were able to buy more coins using their ETH when the price fell.

Some examples were wallets transferring tens of thousands of ETH after remaining dormant for many years, ending up in various ways. Some sold out, and some ended up staking or hoarding. This illustrates that a sole Ethertuem transfer does not provide enough evidence to determine the market direction.

Until now, there has been no public statement made by Joseph Lubin about the Ethereum transfer. The day before the transfer occurred, he shared information on his X account about a token sale known as STRATO.

STRATO sale off to a strong start. Great time to get into HardFi. https://t.co/8NRgUPeTTJ

— Joseph Lubin (@ethereumJoseph) June 5, 2026

He is also the CEO of Consensys, which plays a major role in Ethereum’s ecosystem through tools like MetaMask and Infura.

This article contains market analysis and price predictions. These are not guarantees. Crypto markets are volatile. Always DYOR. Not financial advice.

Also Read | Solana Price Slips Sharply as Market Eyes Long-Term Target Range of $500 to $1,000+

Filed Under: Cryptocurrency News, Altcoin News

Crypto Downfall Triggers Massive Selloff in Bitcoin, Stocks, and Gold

By Zagham Abbas | Edited By Messam Raza,June 7, 2026, 5:00 AM

Global financial markets have witnessed a sudden fall in value in recent days, with the crypto downfall emerging as one of the most closely watched aspects of the selloff. Trillions of dollars in wealth have been wiped out from equities, cryptocurrencies, precious metals, and other risk assets. Bitcoin fell close to the $59,000 mark.

What Caused the Crypto Downfall and the Market Selloff

The recent crypto downfall did not happen in isolation. It followed a wave of strong U.S. economic data that changed expectations around interest rates. The economy added 172,000 jobs in May, nearly double what analysts had predicted, signaling that economic activity is still holding firm.

What Caused the Crypto Downfall and the Market Selloff

Source: Bitinning’s X Post

Usually, information of this kind would foster optimism about markets. This case was different, though. The focus of traders switched to the interest rates, since an improved labor market meant that inflation could stay higher for some time.

With the outlook for imminent rate cuts deteriorating, pressure mounted on both stocks and crypto, exacerbating the crypto downfall.

Also Read | ADA Price Forecast: Fibonacci Support Signals Recovery Toward $0.54 Target

Technology and Risk Assets Drive the Pressure

Technology stocks took the brunt of the fall as the Nasdaq dropped and semiconductor stocks lost more than one trillion dollars in market capitalization collectively. As many AI-related stocks had risen significantly in the past few weeks, profit-taking intensified with reduced prospects for rate cuts.

The crypto downfall adhered to the same trend witnessed in other risky investments. As Bitcoin fell towards $59,000, it brought further declines to all other cryptocurrencies.

The decline was brought about by the fact that investors were pulling out of their volatile investments. Gold also dropped, sliding to a loss of almost 5%.

Technology and Risk Assets Drive the Pressure

Source: Bitinning’s X Post

Why the Crypto Downfall Deepened Across Markets

The crypto downfall got even worse due to increased uncertainty in international markets. Worrying about geopolitics related to Iran has increased fear about energy prices, potentially keeping inflation high for an extended period of time.

Simultaneously, the anticipation of large IPOs for big firms like SpaceX, Anthropic, and OpenAI is also affecting liquidity dynamics. Capital tends to be rebalanced in the run-up to such an event, which could lead to a temporary reduction in capital inflows into risk assets and increase the severity of phenomena like the crypto downfall.

Overall, the crypto downfall demonstrates a new trend where investors’ concerns have shifted from the economy to monetary policies and liquidity. Any positive economic news can now be considered negatively since it will slow down any plans for monetary easing.

As long as inflation signals that it’s not slowing down and the outlook for rate cuts fades, we can expect volatility in stocks, gold, and cryptocurrency to be high, with the crypto downfall playing an important role in that.

This article contains market analysis and price predictions. These are not guarantees. Crypto markets are volatile. Always DYOR. Not financial advice.

Also Read | Hyperliquid Price Crashes to $56: Is HYPE’s Rally Over or Just Pausing?

Filed Under: Cryptocurrency News

Worldcoin Price Drops 23% as Market Eyes Key Demand Zone for Recovery

By Zagham Abbas | Edited By Ammar Raza,June 7, 2026, 4:00 AM

Worldcoin (WLD) price action is under considerable near-term downward pressure, owing to increased selling driven by the recent downtrend. Despite the current bearish tone, the coin is slowly but surely approaching a key buying zone, from which a reversal or rally could potentially emerge.

At the time of writing, WLD is trading at $0.4165, with a 24-hour trading volume of $2.34 billion and a market capitalization of $1.38 billion. The token has fallen 23.17% in the last 24 hours, showing sharp volatility as short-term selling intensifies across the market.

Worldcoin price chart

Source: CoinMarketCap

Also Read | ASTER Price Analysis: Can Bullish Flag Trigger a Rally to $1?

Worldcoin Price Stabilizes After Drop

Crypto analyst, Alpha Crypto Signal, highlighted that the Worldcoin price is gradually getting near an important demand area where buyers can possibly try taking control of the market again. Early responses have reportedly started to emerge around this point, with the price seemingly starting to stabilize after the previous fall.

Worldcoin Price Stabilizes After Drop

Source: Alpha Crypto Signal’s X Post

A possible formation of base at this level, in case of continued buildup of buying interest, will allow the market to enter into the recovery phase instead of continuing with the breakdown process. A breakout above this level will indicate further strength in the Worldcoin price movement.

However, the inability to sustain the zone can keep downward pressure on the price of the coin, which can cause further volatility in its price movement.

Worldcoin Pulls Back After Upper Band Rejection

From a technical standpoint, the Worldcoin price had been rejected following an attempt to break through the top Bollinger Band at $0.53937, causing it to sharply fall back to $0.40877. Despite the decline, the Worldcoin price is still trading above the middle Bollinger Band at $0.35020, indicating that its overall trend pattern is still valid for the time being.

Worldcoin Pulls Back After Upper Band Rejection

Source: TradingView

The momentum indicators have also come up with a similar kind of positive outlook for the Worldcoin price. This is because MACD is still trading in the positive zone, where the MACD line is at 0.05587 while the signal line is at 0.03990.

While the histogram reading may have declined slightly to 0.01597, it suggests that there is still some buying interest left in the market.

This article contains market analysis and price predictions. These are not guarantees. Crypto markets are volatile. Always DYOR. Not financial advice.

Also Read | Chiliz Price Drops to Multi-Year Low as Analysts Eye Potential Rally Toward $0.65

Filed Under: Cryptocurrency News, Altcoin News

Bittensor Price Prediction: Can Bulls Push It Toward $400–$500 Rally?

By Sadia Ali | Edited By Ammar Raza,June 7, 2026, 3:00 AM

Bittensor (TAO) remains in a downtrend with sellers still dominating market structure and resistance ahead for the Bittensor price. Momentum is weak, and oversold conditions do not confirm a reversal. Thin liquidity increases downside risk, and a recovery would require a clear breakout above resistance with stronger volume and sustained higher lows.

At the time of writing, TAO is trading at $193.82 with a 24-hour trading volume of $199.95 million and a market capitalization of $2.13 billion. Despite the 2.32% decline over the last 24 hours, the TAO price structure points to a bullish reversal ahead.

TAO Price chart

Source: CoinMarketCap

Also Read: TAO Price Consolidation Tightens Above $200 as Traders Await Major Breakout

Bittensor Price Recovery Points to a Rally Toward $500

Furthermore, the crypto analyst 2xnmore highlighted that while the Bittensor price sits around $198, the technical indicators show the possibility of pulling back from its positive sentiment. 

The RSI reading close to 25 shows low momentum rather than confirming that it has bottomed out. A volume study has indicated lower liquidity below the present level, with $170 being the lowest support before the low volume gap.

The market continues to show a bearish bias until the Bittensor price crosses above the level of control at around $315, from where the bulk of historical volume occurred. 

The Bittensor price action below this level suggests that sellers continue to be in control, with any rallies facing the threat of being sold into an overhead supply.

Bittensor Price Recovery Points to a Rally Toward $500

Source: 2xnmore’s X Post

For a real recovery, the Bittensor price needs to see a new high above $170 before it breaks out above $315 on volume. 

This is when it becomes realistic for targets around $400-$500 to materialize. However, until such a formation materializes, $198 is vulnerable ground for any accumulation call to be made prematurely.

Technical Outlook Points to Bearish Pressure

According to TradingView, the Bittensor price reveals a pronounced downward trend till early June with an aggressive drop from the $280.00 level of resistance. 

Following an aggressive dump in the market on June 3, a period of stability around the $185.00 level was established. Currently, the most recent candle reveals some consolidation at the $194.31 level.

Technical Outlook Points to Bearish Pressure

Source: TradingView

Based on the technicals, this heavy selling force appears to be quite exhausting considering that it’s happening in the depths of the oversold level. 

In this regard, the RSI is seen near 28.65, which is slightly above the crucial support at 30. On the other hand, the MACD line may soon flatten from -11.43 due to lower negative histograms.

This article contains market analysis and price predictions. These are not guarantees. Crypto markets are volatile. Always DYOR. Not financial advice.

Also Read: TAO Holds Near $250 as Analyst Tracks Key $225 Support

Filed Under: Cryptocurrency News, Altcoin News

Zcash Ironwood Upgrade Targets Supply Verification

By Yahya Raza Sherazi | Edited By Ammar Raza,June 7, 2026, 2:00 AM

Zcash Ironwood has been proposed as a network upgrade to help users verify ZEC’s circulating supply after a critical Orchard flaw. Shielded Labs introduced the plan with several Zcash groups. The proposal follows an emergency upgrade completed on June 2.

The announcement is connected with a counterfeiting vulnerability in the Orchard shielded pool. The June 2 emergency upgrade fixed that vulnerability, said developers. The new plan is to allow supply verification by regular users with Zcash nodes.

Also Read: Galaxy Research Warns CLARITY Act Could Face Major Delays in 2026

Zcash Ironwood Sets Supply Verification Rules

The proposal would allow users to verify supply through the sum of balances of active pools in Zcash Ironwood. This ability would begin immediately after activation. Users would no longer have to depend on external reviews for determining the correctness of the circulation ZEC.

The upgrade will result in a new shielded pool utilizing the Orchard circuit. That pool would include the fix for this recently discovered vulnerability. It would also refuse any transaction that attempts to create outputs in the old Orchard pool.

Funds already held in the existing Orchard pool would not be erased. After activation, however, Zcash Ironwood would limit the movement of those funds. They can only leave the platform through Zcash’s turnstile accounting system, which is restricted by transfers from recorded inflows.

The design would enable supply integrity throughout the network, the proposal states. Within limits, legitimate balances may be transferred from the affected pool. The turnstile mechanism would prevent any excess amount from escaping.

Zcash Ironwood Adds On-Chain Exploit Checks

Zcash Ironwood could even generate public proof of whether the vulnerability was exploited. The proposal stated that this is not the primary intent of the upgrade. However, fund migration might indicate if there is any unbacked ZEC that tries to leave the old pool.

That would present a stark decision for a potential counterfeiter. They could try to move fake ZEC and risk detection. They may also leave those funds behind, which will continue to have no impact on the verified supply.

Developers stated that if no surplus ZEC were trying to leave the old pool, it would be a good sign that there is no attempt to exploit. If excess funds attempt to move, turnstile rules would stop them. That would give us clear on-chain evidence of the problem.

For wallets, those that support Orchard would have to add compatibility with the new shielded pool. Orchard addresses would continue to be valid post activation. Once Zcash Ironwood is active, new incoming funds will automatically flow to the secure pool.

Zcash Ironwood is still in the process of development, testing, review, and ecosystem coordination, the developers said. Migration could show transfer timing and amounts and have limited privacy trade-offs. The conversion of legacy zcashd to Zebra might also complicate the upgrade schedule.

Also Read: SpaceX and Google $920M AI deal reshapes global compute market

Filed Under: Cryptocurrency News

HTX WLFI Freeze Triggers USD1 Conversion to USDT

By Yahya Raza Sherazi | Edited By Messam Raza,June 7, 2026, 1:30 AM

HTX WLFI freeze has forced the Seychelles-based crypto exchange to suspend several WLFI-linked trading pairs. The exchange also started converting user USD1 balances into USDT. The decision followed adverse restrictions imposed by World Liberty Financial over UK sanctions compliance reviews.

According to the report, HTX said the suspension is effective as of 13:00 UTC on June 5, 2026. This involves the WLFI/USDT, USD1/USDT, BTC/USD1, and ETH/USD1 pairs. The exchange said the step was taken to protect users and reduce market risk.

Also Read: Galaxy Research Warns CLARITY Act Could Face Major Delays in 2026

HTX Challenges WLFI Over Frozen User Assets

The WLFI team has frozen certain on-chain addresses following compliance checks, HTX says. The restricted wallets were user-owned assets, the exchange said. It also stated that the assets were not related to HTX or any entity under sanctions.

The HTX WLFI freeze has resulted in a legal battle between the exchange and WLFI. HTX stated that the user assets were restricted without providing sufficient notice. It also stated that the decision was lacking in clear legal basis, with no transparency in procedures.

In an official statement, HTX condemned the act. The exchange stated that WLFI had failed to communicate or provide due process. It also said that the decision impacted the rights and interests of HTX users.

Liu Ye, HTX’s spokesperson and marketing head, also responded to the issue. The impacted assets were lawfully acquired by end-users, she said. She added that they were not held for any sanctioned party.

The HTX WLFI freeze also brought up concerns regarding asset ownership in blockchain networks. Liu stated that lawful-use assets should not be constrained in any project without reasons. She said user ownership remains a key principle of digital asset markets.

Something deeply concerning happened recently.

The WLFI team froze WLFI tokens held in HTX-related addresses, citing the ongoing UK sanctions review.

To be clear:

These are not assets belonging to any sanctioned entity.

They are not HTX’s assets.

They are assets legally… https://t.co/duQg1xDBSy pic.twitter.com/UI8hJYnN48

— 火币HTX六爷|火币赚币 (@HTX_Molly) June 6, 2026

HTX WLFI Freeze Leads to USD1 Conversion Plan

HTX has officially requested WLFI to lift the address restrictions. The exchange also halted related trading operations until the situation was clarified. According to HTX, users can still see their WLFI balances in their accounts.

Withdrawals will restart once the on-chain limits are lifted. HTX stated that the tokens are not lost. The user, however, is not able to move the affected WLFI assets during the issuer-side restriction.

USD1 service was also impacted by the HTX WLFI freeze. HTX will change all user USD1 holdings to USDT, it said. Additional details on the conversion will be subsequently announced in a separate statement from the exchange.

HTX also stopped deposits and withdrawals on USD1. The conversion is a measure to protect users, the exchange said. HTX reported that the WLFI team issued USD1.

The exchange also discussed mentions of Huobi Global S.A., stating that it is distinct from the online platform, HTX. It also said that no sanctions designation of the entity will impact HTX’s operations or user funds.

The HTX WLFI freeze remains to be concluded until WLFI removes the restrictions. Trading and withdrawals of the affected assets are suspended. Users of HTX have been requested to wait for the official announcement for information on conversion and withdrawals.

Also Read: SpaceX and Google $920M AI deal reshapes global compute market

Filed Under: Cryptocurrency News

Injective Price Tests Key Support as Bullish Momentum Builds Toward $50 Rally

By Sadia Ali | Edited By Ammar Raza,June 7, 2026, 1:00 AM

Injective (INJ) is testing a long-term support zone that previously led to strong rallies, while technical indicators show early bullish momentum for the Injective price. Rising network activity and record user growth suggest stronger adoption, placing the asset at a key point where it may either continue its uptrend or weaken.

At the time of writing, INJ is trading at $5.10 with a 24-hour trading volume of $133.35 million and a market capitalization of $510.5 million. Despite the signs of stability over the last 24 hours, the question is whether the INJ price structure and network growth could lead to new highs.

Injective price chart

Source: CoinMarketCap

Injective Price Suggests Possible Run Toward $50+

According to the crypto analyst Third Eye, the Injective price has been retracing back to another very important long-term macro trendline, which it has hit near the price of $5.30, representing a strong accumulation zone in history. 

Past encounters with this level were followed by some very explosive moves upwards over 1,000%, making for a strong bullish case around this trendline.

Injective Price Suggests Possible Run Toward $50+

Source: Third Eye’s X Post

The question on everyone’s mind is if the pattern continues. Optimists predict a return to the $40-$50+ range based on this historical repeat. 

However, there are others who believe that the cycle in markets could render previous performance obsolete. The Injective price now stands at an important crossroads, and depending on whether growth or failure occurs, it will be clear what the future holds.

Also Read: Injective (INJ) Price Analysis: Elliott Wave Structure Points Toward $13.17

MACD Bullish Crossover Point to Improving Sentiment

According to TradingView, the Injective price is characterized by a bearish macrocycle, as it drops from its high point at $34.00 to the crucial low point of $2.50. Yet, there is a very strong bullish turnaround going on in the process. 

The Injective price has crossed over the 3.71374 midline of the moving average and reached the 5.65183 Bollinger Band with the closing price at 5.09840.

MACD Bullish Crossover Point to Improving Sentiment

Source: TradingView

The momentum indicators further support this structural shift in trend for the Injective price. The blue line on the MACD indicator has decisively moved above the orange signal line from -1.03891 to -0.45820. 

However, the histogram indicator is printing positive green candles at 0.58071 amid expansion. Furthermore, the Injective price is experiencing a breakout from its accumulation stage as the lower band rises to 1.77565.

Injective Hits Record 91.5K Daily Active Users

The data from Everstake further highlighted that the ecosystem momentum in Injective continues to be strong, especially considering that the platform has surpassed 91,500 daily active users, setting another record. 

Month-over-month growth has been evident through increased participation on the platform’s DeFi ecosystem. This can be attributed to increasing app usage, development, and financial activity on-chain.

Injective Hits Record 91.5K Daily Active Users

Source: Everstake’s X Post

Injective’s increase in usage comes through sustained growth, instead of peaks, indicating consistent demand for Injective’s top-notch trading and decentralized finance infrastructure. 

Higher utilization by builders, validators, and end-users has resulted in further network effects. As the network becomes larger, it matures to become a fully functional liquidity-based on-chain financial system.

This article contains market analysis and price predictions. These are not guarantees. Crypto markets are volatile. Always DYOR. Not financial advice.

Also Read: Injective Price Falls 17% After Major Support Break, More Downside Ahead?

Filed Under: Cryptocurrency News, Altcoin News

Bhutan Bitcoin Transfer Moves 738 BTC to New Wallet

By Yahya Raza Sherazi | Edited By Ammar Raza,June 7, 2026, 12:59 AM

Bhutan Bitcoin activity drew attention after the Royal Government of Bhutan transferred 738 BTC. The assets were worth about $44.9 million, according to blockchain transaction data. The transfer shifted the assets from government-associated wallets to a new external address.

Arkham data shows that the transfer came from wallets associated with Druk Holding & Investments, Bhutan’s state investment company. The receiving wallet was newly created. No public reason has been provided for the wallet movement.

Also Read: Professional Bitcoin Holdings Fall 17% as Hedge Funds Exit Positions

Bhutan Bitcoin Transfer Raises Market Attention

The Bhutan Bitcoin transfer was notable, as the significant wallet transactions by the government can impact the trader sentiment in the market. 

These activities can include changes in custody, restructures in operations, or preparation of settlements over the counter. However, the available blockchain data does not show that a sale took place.

With state-backed Bitcoin mining, Bhutan is emerging as a significant sovereign player in the crypto sector. Unlike many governments that acquire digital assets primarily through seizures or enforcement proceedings, its approach is unique. 

Instead, Bhutan has created Bitcoin exposure by operating Bitcoin mining facilities powered by hydropower.

Bhutan’s involvement in Bitcoin is a unique scenario in national digital asset policies. The nation has made its energy resources directly connected to Bitcoin production. As a result, wallets connected to Bhutan remain under blockchain analyst watch.

The recent transfer comes after earlier transactions from wallets linked to Bhutan. During the month of April 2026, the Royal Government of Bhutan transacted 319.7 BTC. The purpose of that transaction also remains unknown at this point.

Source: Lookonchain

Bitcoin Wallet Transfers Draw Liquidity Speculation

The miner movement in April coincided with a broader trend of activity across the crypto sector. Miners were reacting to the cost of energy, the difficulty of mining, and market conditions. The hashrate of the Bitcoin network also remained steady around 1.107 zettahashes per second.

Large money moves are usually noticed because traders look for potential liquidity signals. However, wallet transfers do not necessarily indicate selling or exchange activity. Digital assets are frequently transferred for security, accounting, or custody reasons.

The latest Bhutan Bitcoin transaction still has no publicly confirmed purpose. It is an indication of ongoing activity on wallets associated with Bhutan’s reserves. It also emphasizes the fact that sovereign crypto holdings are not hidden behind any public blockchain tracking.

Market participants are likely to continue observing Bhutan Bitcoin wallets following the 738 BTC transfer. Additional activity may give more information on custody or reserve management. For now, the transaction shows active handling of Bhutan Bitcoin reserves without confirmed disposal.

Also Read: Galaxy Research Warns CLARITY Act Could Face Major Delays in 2026

Filed Under: Cryptocurrency News, Bitcoin (BTC)

TRON Price Analysis: Bullish Structure Holds as Traders Eye $0.45 Breakout

By Sadia Ali | Edited By Ammar Raza,June 6, 2026, 11:59 PM

TRON (TRX) remains in a bullish structure with higher highs and higher lows intact for the TRON price while holding key support despite recent volatility. Momentum has slowed, but the broader trend stays positive with buyers defending levels. A new U.S. listing may improve access, liquidity, and long-term demand.

At the time of writing, TRX is trading at $0.3224 with a 24-hour trading volume of $621.09 million and a market capitalization of $30.57 billion. Despite the signs of stability over the last 24 hours, the question is whether the TRX price could maintain its key support to keep the bullish trend intact.

TRON Price Chart

Source: CoinMarketCap

TRON Price Structure Points to a Rally Toward $0.45+

According to the crypto analyst ELIX, the bull setup is still intact for the TRON price despite the formation of the negative wick of -8.65%. 

The TRON price is still staying above an ascending trendline and a strong demand zone, which indicates that the buyers are fighting to maintain the support line in their favor.

TRON Price Structure Points to a Rally Toward $0.45+

Source: ELIX’s X Post

Reclamation of the area around $0.33-$0.34 will enhance the momentum for the TRON price, with further movement toward $0.36 likely and even higher levels of $0.40-$0.45+ possible if we get another bullish year of 2026. 

The positive fundamentals due to utility demand, along with the strong technical picture, remain supportive of the bull case.

Also Read: TRX Price Eyes $0.366 Breakout as Inverse Head and Shoulders Pattern Forms

TRX Weekly Outlook Points to a Cautious Approach

According to TradingView, the TRON price is currently experiencing a bullish trend in the long term but faces immediate pressure to sell. 

However, its current candlestick is bearish as the TRON price falls by 8.16% to $0.32230 with an attempt to reach the 20 EMA at $0.32415. However, the uptrend continues since the 50, 100, and 200 EMAs are

TRX Weekly Outlook Points to a Cautious Approach

Source: TradingView

However, MACD signals that the TRON price momentum is slowing towards mid-2026 as it continues higher. Even though the MACD value at 0.01331 and the signal line at 0.01056 still show that the former is above the latter, there is an indication of slowdown, with the MACD histogram falling to 0.00275.

TRX Enters U.S. Market via Bitnomial Spot Listing

The data from the TRON DAO further highlighted that it has been announced by TRON that their native crypto coin, TRX, is now spot listed on the exchange BitNomial. 

This listing will give U.S.-based traders easy access to TRX via an exchange that is regulated, thus increasing their exposure to one of the busiest blockchain communities.

TRX Enters U.S. Market via Bitnomial Spot Listing

Source: TRON DAO’s X Post

TRX is used in making transactions, executing smart contracts, and running decentralized applications on the TRON blockchain network. Additionally, it enables certain governance operations that impact the development of the network. 

This listing will make liquidity more available by adding TRX to the regulatory framework of the U.S. financial system.

This article contains market analysis and price predictions. These are not guarantees. Crypto markets are volatile. Always DYOR. Not financial advice.

Also Read: TRX Price Pulls Back After May Rally: Can Institutional Buying Trigger a New High?

Filed Under: Cryptocurrency News, Altcoin News

  • « Go to Previous Page
  • Page 1
  • Interim pages omitted …
  • Page 46
  • Page 47
  • Page 48
  • Page 49
  • Page 50
  • Interim pages omitted …
  • Page 3714
  • Go to Next Page »

Primary Sidebar

Recent Posts

  • PEPE Price Prediction: Falling Wedge Signals Breakout to $0.00001050 June 23, 2026
  • KuCoin Pay Unveils 2 Powerful QR Payment Expansions June 23, 2026
  • Base Builder Codes Add On-Chain Tracking for x402 Payments June 23, 2026
  • XRP Community Alert: 14,646 XRP Lost in Scam June 23, 2026
  • MoonPay Entendre Acquisition Expands AI Finance Strategy June 23, 2026

Footer

News

  • Latest News
  • Altcoin News
  • Bitcoin (BTC)
  • Blockchain
  • Tron (TRX)
  • World

Digest

  • Meet the Founder
  • Price Winning Article
  • DeFi
  • Cyber Security
  • Crypto Scam

Industry

  • Project Review
  • Technology
  • Fintech
  • Tron Exchange
  • New in Town

Tron Universe

  • Event and Tron Parties
  • New in Town
  • Tron Tokens

FOLLOW US

  • Facebook
  • Telegram
  • Twitter
  • Linkedin

Subscribe US

Editorial Policy | Privacy Policy | Disclaimer | Terms and Conditions | Masthead

Copyright © 2026 · Tron Weekly. All Rights Reserved. NOTE: Tron Weekly is an independent crypto news site that adheres to the strict journalism policy anchored on transparency, trust, and objectivity, we have no affiliation with the TRON Foundation, its founder Justin Sun or any other cryptocurrency firm.