There is an escalating level of institutional interest in tokenized assets. The TRON blockchain is now the most recent blockchain to have a large-scale private credit offering within the tokenized asset space. At press time, TRON price was trading at $0.3373, down 1.83% over the past 24 hours.
TRON Price Holds Near $0.337 After Recent Pullback
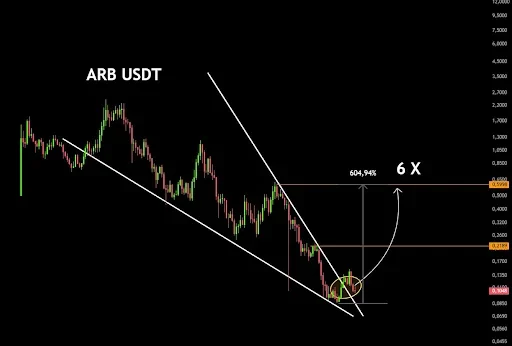
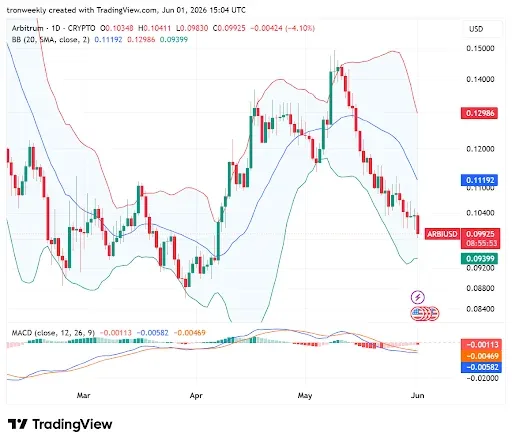
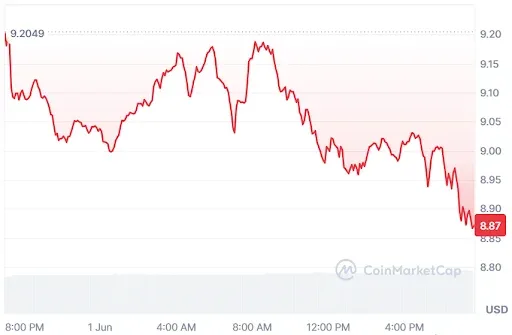
The TradingView chart indicates that TRON price had previously risen towards resistance near $0.38, while TRON continues to trade close to the region of support at $0.337. Even with price pulling back from its high, TRX still trades at higher values than those seen earlier this year.
In addition to this price action, the On-Balance Volume (OBV) continues to be elevated, which indicates that there remains a strong amount of participation in the market despite changes in momentum.

Also Read: TRX Price Eyes $0.366 Breakout as Inverse Head and Shoulders Pattern Forms
TRON Price in Focus Following Hamilton Lane Fund Launch
Recently, Hamilton Lane’s tokenized Senior Credit Opportunities Fund (HLSCOPE) launched on the TRON ecosystem via Securitize, according to a recent announcement.
This new launch marks the first Securitize-issued digital asset on the TRON platform, as the launch provides a new way for investors to access the vibrant tokenized private credit sector.
This development represents another significant milestone for the growing trend of real-world assets (RWAs) and the ongoing integration of blockchain technology into traditional financial markets.
While this news did not provoke a significant spike in TRON value, it does emphasize TRON’s ongoing interest in building institutional-level alternative financial instruments within its ecosystem.
At approximately $0.337, TRON continues to be vulnerable to short-term price declines, although the launch of HLSCOPE will support additional efforts by the TRON ecosystem to build a presence in the RWA space. Investors will likely be monitoring both ecosystem developments and critical support levels in the near term.
Also Read: TRX Price Holds Key Support as Bulls Eye a Potential Rally Toward $3 Target