SUI is holding a key support zone after a strong downtrend, with sellers still dominant but signs of potential accumulation emerging. A rebound could build recovery momentum for the SUI price if buyers return with strength and sentiment improves, while failure to hold may extend the corrective move.
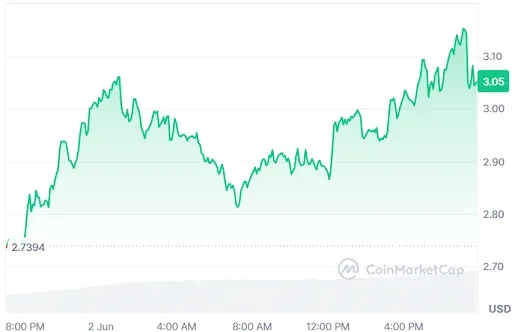
At the time of writing, SUI is trading at $0.3832 with a 24-hour trading volume of $702.75 million and a market capitalization of $3.32 billion. Despite the 5.91% loss over the last 24 hours, the SUI price structure and rising volume point to a bullish reversal.

Source: CoinMarketCap
SUI Price Holds Critical Support After Downtrend
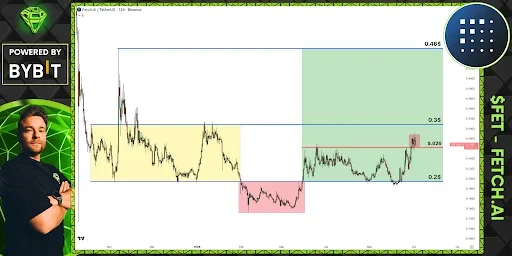
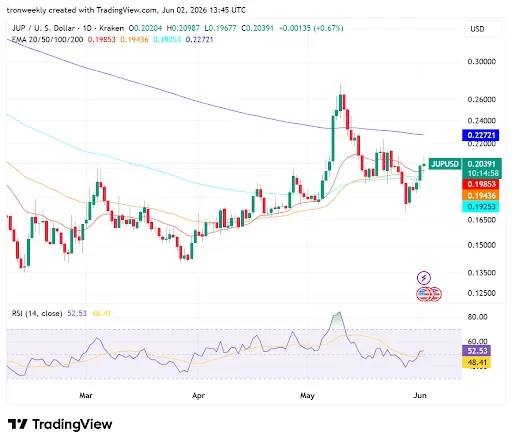
According to the crypto analyst BitGuru, the SUI price is near an important support level, with the negative trend persisting and weakening the positive sentiment bit by bit.
Sellers dominated in the recent sessions, moving the SUI price towards a level that is attracting attention at the moment. Despite the overall negative sentiment, this level appears to be gaining some traction as a potential accumulation point.
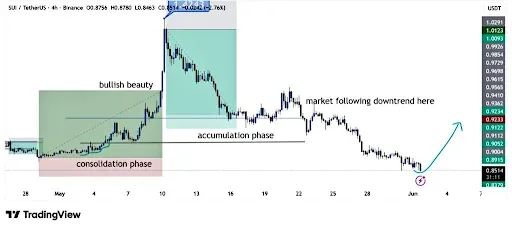
Source: BitGuru’s X Post
With determination on the part of buyers, however, such assistance might just set the foundation for an ensuing recovery for the SUI price and influence the setup going forward.
Any move higher from here could lead to recapturing the $0.92 mark, provided that volume picks up and sell-off pressure diminishes. Confirmation is lacking, however, due to the unclear situation prevailing.
Also Read: SUI Analyst Reviews $0.60–$0.90 Zone After 1,300% Rally
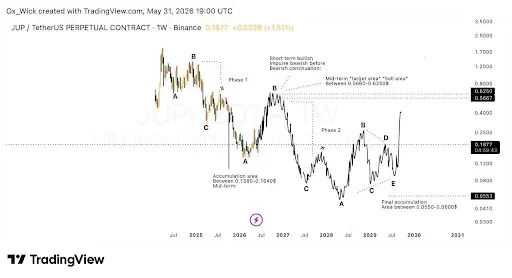
SUI Price Could Target $5.36 If Support Holds Strong
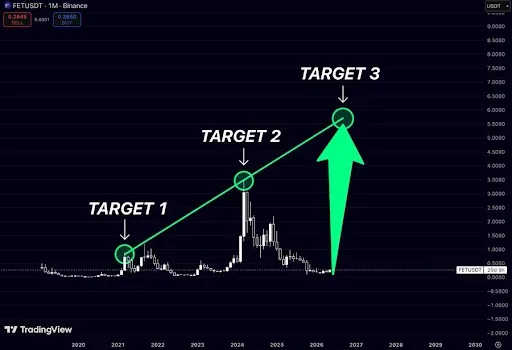
Moreover, the data from Sui Community further highlighted that the SUI price is positioned within an important technical support region because the price has returned to a level where it once halted one of its most formidable price surges in history.
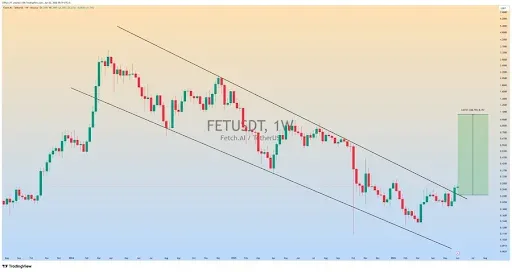
The resistance of $2.15 is currently closely monitored since it is viewed by market participants as a crucial barrier for buyers.

Source: Sui Community’s X Post
The SUI price setup remains grounded on the crucial resistance levels of $4.43 and $5.36, which have been prior key support levels and swing highs.
Trading interest seems to be rising as the traders position themselves at the aforementioned levels, creating a web of ambiguity and volatility. The next move that takes place at $2.15 will determine whether the impetus gains pace for an upward trend.
SUI Rising Volume Could Lead to a Bullish Breakout
However, the SUI trading volume increased by 26.70%, reaching $1.05B, indicating stronger market activity and heightened participation from traders across the market, reflecting improved liquidity, interest, and momentum in trading behavior.
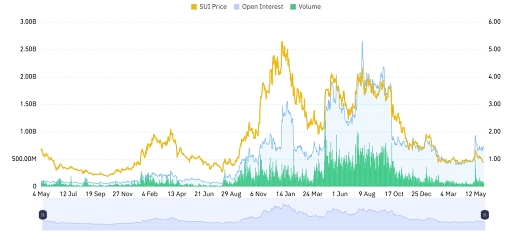
Source: Coinglass
However, the open interest declined by 10.75% to $618.52 million. This indicates less open interest and reduced participation among the traders in the derivatives market. This could possibly mean that the traders are either closing their positions or reducing their risks.
This article contains market analysis and price predictions. These are not guarantees. Crypto markets are volatile. Always DYOR. Not financial advice.
Also Read: SUI Price Holds Key Support Despite Repeated Outages As Analysts Target $18