• Skip to primary navigation
  • Skip to main content
  • Skip to primary sidebar
  • Skip to footer

TronWeekly

Crypto World News

  • Home
  • Education
    • Best TRON Wallets
    • Beginner’s guide to TRON
  • Opinion
    • Tron Tokens
    • Market Analysis
  • Industry
    • Tron Exchange
    • Project Review
  • Press Release
  • Advertise
  • About us
    • The Team
    • Editorial Policy
    • Write for us
    • Privacy Policy
    • Disclaimer
    • Terms and Conditions
    • Contact
You are here: Home / Archives for Utkarsh Gupta

Utkarsh Gupta

XRP, Bitcoin SV, EOS Technical Analysis on 24rd August 2020

August 24, 2020 by Utkarsh Gupta

The brakes are being pulled on the altcoin rally at the moment. After close to 3 weeks of the bullish rally, the majority of the digital assets were exhibiting strong corrections on the market charts. While the correction has slowed down over the past day, the trend is still significantly bearish at the moment.XRP, Bitcoin SV, EOS technical analysis is given below

XRP hourly chart

XRP tron 1 e1598266605796

Since 17th August, XRP has declined dropped from $0.32 to its present valuation at $0.290. Although the price has undergone a minor hike of 3.07% in the past day, it remains fairly in the bullish realm. XRP market capitalization jumped above $13.02 billion after topping off near $14 billion a few days back. With a trading volume of $1.24 billion, XRP maintained its position as the 3rd largest digital asset.

Now, market indicators suggested that XRP might be entering a period of another bullish rally. Chaikin Money Flow or CMF suggested that the token had high capital inflows than outflows as MACD suggested that a bullish crossover in the charts. Bollinger Bands for XRP suggested a neutral trend as the bands appeared to be parallel to each other.

Bitcoin SV hourly chart

BSV tron e1598266761965

For Bitcoin SV, it is currently near its resistance at $199. The last time BSV was valued below this range was on 27th July. However, the asset’s inability to maintained a price higher than $217 has now entertained a huge retracement. However, Bitcoin SV had registered a gain of 3.10 percent over the past day.

Bitcoin SV is currently the 8th largest digital asset with a market capitalization of $3.68 billion. Analyzing the Relative Strength Index or RSI for BSV, it can be suggested that buying pressure is slowly taking over in the markets, as Bollinger Bands exhibited more volatility going forward.

BSV’s Parabolic SAR was bullish as well with the dotted indicator firmly under the candlesticks.

EOS hourly chart

EOS tro

12th ranked EOS continued to have a poor 2020. The token that was once ranked 4th in the charts currently exhibited a low market cap of $3.17 billion at the moment. For EOS, markets have remained rather neutral with the occasional surge and spike in prices. Although the token has dipped over the past week, it continues to exhibited tepid volatility levels as the valuation continued to be under the resistance of $3.40.

Aroon indicator suggested that the price may under another bearish onslaught as the bearish market completed a reversal over the bullish market. However, Awesome Oscillator pictured positive momentum as the candlesticks turned green at the end of the indicator.

Filed Under: Altcoin News, News Tagged With: Bitcoin SV, bitcoin SV technical analysis, cryptocurrency news, cryptocurrency technical analysis, EOS, EOS technical analysis, Ripple (XRP), xrp technical analysis

Bitcoin Price Prediction: BTC Could Be Pushed Down to $10,500 Due to Bearish Divergence

August 24, 2020 by Utkarsh Gupta

Bitcoin’s administered one of the most volatile weeks in 2020. After clocking in a new high of $12,400 for the year, the asset’s correction downwards has taken the industry on a backfoot. While many suggested such a correction is a healthy part of a bull run, a drop close to $1000 has raised a lot of eyebrows, suggesting that the rally till $12,400 was effectively a bull trap for a massive price drop. With Bitcoin currently valued at $11564, we analyzed the markets and understood that the digital currency is possibly at a tipping point in the market.

Bitcoin 1-day chart

Bitcoin e1598180910776

Since the start of August, Bitcoin has attained an ascending channel pattern that symbolizes an eventual bearish breakout. Until now the valuation has oscillated between both the trend lines but at the moment, it is very near towards a pattern breach. The important resistance for Bitcoin stands at $12,011 which was briefly breached on 17th August but the asset dropped below within 24-hours.

Now, considering the bearish pullback does take place, the situation may pan out in the following two ways.

Bitcoin has immediate support at $11150 that was tested once early in August. Since then the asset had been able to maintain a position above. Now if BTC does break out of the pattern, if the support at $11,150 is held, Bitcoin could nurse a quick turnaround and re-test resistance at $12,000.

However, if the selling pressure sustains, Bitcoin may inevitably drop down to support at $10,500 before picturing any form of recovery. Right now, the bearish divergence created between Bitcoin rising prices and falling trading volume is a major red signal. With Relative Strength Index trailing down as well, Bitcoin main actually dropped down to $10,500 after the pattern breach has taken place.

Bitcoin 4-hourly chart

Bitcoin 50 e1598180944370

For extensive analysis, we studied the 4-hour chart as well, and even though the 4-hour chart attained a bullish broadening channel pattern, the 50-Moving Average continued to trail above the price. Since attesting a bullish rally on 17th August, the 50-MA has acted as a strong overhead resistance. For Bitcoin to entertain any bullish rally at the moment, this over-head resistance needs to be turned around otherwise, a correction phase is all that seems to take place on the horizon.

Filed Under: Bitcoin News, News Tagged With: bitcoin price, btc

Apple Accused of Being “Hostile and Restrictive” by Coinbase CEO; Epic Games Files Lawsuit

August 23, 2020 by Utkarsh Gupta

Cryptocurrencies have faced a lot of restrictions and criticism from big tech-firms over the years. While these digital assets continue on their pursuit to innovate payments and transactions, its new direction hasn’t always taken flight with other major corporations.

Now, one of the major organizations that have been rigid towards certain innovations over the years has been Apple, and in a recent conversation, the entities’ “rules” were under the spotlight.

Remember: Apple’s iOS rules would not have allowed for the invention of the web browser. Let that sink in. They would have rejected one of the most important technical innovations in the history of computing. Microsoft‘s bully tactic of making IE free seems quaint in comparison.

— Francisco Tolmasky (@tolmasky@mastodon.social) (@tolmasky) August 22, 2020

In response to this thread on Twitter, Brian Armstrong, CEO of Coinbase also raised his voice and suggested that Apple hasn’t been very cordial about cryptocurrency transactions as well. according to Armstrong, Apple has been very “restrictive and hostile” towards digital assets over the years as the CEO suggested that the company has been repetitively blocking some of the major crypto functions.

He added,

“They’re still blocking some functionality right now, including the ability to earn money with cryptocurrency by completing tasks, and unrestricted dApp browsers.”

Armstrong was probably talking about the Coinbase Earn exchange, an initiative that allows its users to earn cryptocurrency like Bitcoin by learning about it. Coinbase also cited its reasons back in December 2019 that it had to comply with the AppStore rule and hence removed the functionality of the dApp browser from their application.

Back then, Armstrong suggested that the decentralized form of innovation was an important move in the world of finance and a majority of early adopters had millions of dollars worth of crypto tied to these financial applications.

Apple’s long-legal problems with other organization

For Apple, their restrictions currently go far beyond in-app functionality. A week earlier, Epic Games filed a legal suit against Apple Inc. for allegedly monopolizing third-party payments markets and making innovations such as BTC payments impossible.

According to the lawsuit, Apple had imposed “an oppressive” 30% sales tax on application sales with the game and also made third-party payments redundant.

Epic Games had put forward a request in front of the U.S District Court of Northern District California to force Apple to not act in an an-competitive manner and let go of their hold over the in-app payments system.

Filed Under: Bitcoin News, Industry Tagged With: Apple, Bitcoin (BTC), Brian Armstrong, Coinbase

Ethereum and Ether: Are Their Futures Align in Terms of Growth?

August 22, 2020 by Utkarsh Gupta

Ethereum is rapidly becoming the most widely used blockchain in the industry, and its rising transaction fees are evident in the current situation. Congestion has been created for a number of reasons, with DeFi and Tether’s issuance being the top two reasons.

Now, with demand for block space getting out of hand, it was recently reported that Tether had adopted Ethereum’s scaling solution OmiseGo (OMG) network in order to reduce the confirmation time of the transaction,

As indicated earlier, the adoption of OmiseGo token might have helped on its expedition of doubling its value in the past week. However, with Ether largely becoming irrelevant on its own blockchain, is there a future where Ethereum’s growth continues to pull Ether’s value up?

Ether will accrue Ethereum’s value; eventually

According to a recent blog post shared by Ethereum supported by Ryan Sean Adams, it was explained that Ether’s demand would not be replaced on ETH due to three simple reasons. First, the blog stated that Ethereum’s block space demand makes Ether valuable as well because the native token is the only settlement medium on the platform. It was explained,

“There’s virtually an endless amount of use cases for Ethereum’s blockspace. All of it drives a tiny demand for ether.”

Secondly, Adams believed that the primary ethos of cryptocurrencies is to minimize the dependency of capital on centralized entities. DeFi is currently playing a critical role in that movement and it perfectly falls in place with Ethereum’s money protocol.

Right now, Ether is the most trust-minimized asset on the blockchain and Ether will continue to hold capital priority in the ETH economy.

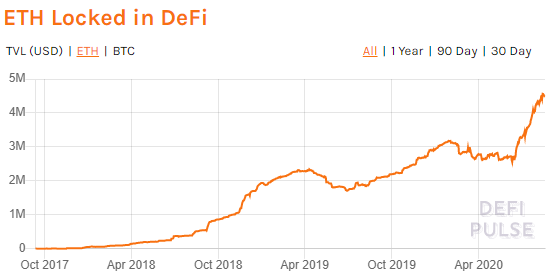
https%3A%2F%2Fbucketeer e05bbc84 baa3 437e 9518 adb32be77984.s3.amazonaws.com%2Fpublic%2Fimages%2Fc1189d7d 2c77 4f76 a0b3

The post added,

“This demand for ETH from DeFi is apparent in the data too. There’s now over 4.5 million ETH locked up in Ethereum financial protocols—valued at nearly $2B. This means that roughly 1 in every 25 ETH in circulation is locked up in DeFi right now.”

Lastly, Sean Adams believed that the imminent implementation of Ethereum 2.0 will lead to Ether’s value in the future to be looked as a productive asset. In fairness, in spite of these strong arguments for Ethereum, these are still assumptions based on what can happen whereas the current facts are that Ether has not been able to keep up with Ethereum’s development. Hence, only time will tell if Ether’s price position improves with respect to Ethereum’s growth as a blockchain.

Filed Under: Altcoin News, News Tagged With: DeFi, ETH, Ether, Ethereum (ETH)

Bitcoin SV, Ethereum, Chainlink Technical Analysis on 21 August 2020

August 21, 2020 by Utkarsh Gupta

The altcoin rally is finally beginning to slow down after a rapid start to August in 2020. In the last 7-days, top altcoins have faced massive drops in terms of price valuation, while others suffered a quick pullback after registering a new high. Ethereum was one of the unlucky ones to witness that fate as its quick rise to $442 has been largely dismissed in the past few days. In the meantime, Chainlink registered a drop of 8% percent as well, after its heroic climb to $20.

Ethereum 

Ethereum
Ethereum hourly chart

It took Ethereum 14 days to break above $400 resistance but when it did, it went on to rally beyond the immediate resistance. Reaching a high of $442, users believed that the ecosystem had built up high bullish momentum over the past 2 weeks’ consolidation. Sadly that wasn’t the case as five days later, Ethereum crashed below the support of $419, briefly testing $397 as well.

With a market cap of $43 billion currently worth $415, Ethereum ‘s market is still struggling to show strong signs of bullishness, as another return below $400 seems likely. Bollinger Bands indicated reduced volatility but the relative strength index indicated saturation. An increase in selling pressure may bring the price down again, as the Parabolic SAR indicated a bearish trend.

Chainlink 

LINK 3
Chainlink hourly chart

For Chainlink, the pullback was more dramatic. The asset has reached 5th in the rankings recently(6th at the moment) on the back of a bullish rally that took its price to $20. However, since then it has been a week of downhill. Chainlink is valued at $15.50 at the moment, briefly testing $14.95 over the past few hours.

The downtrend in the above chart is clear as day as the asset undergoes continuous decline but Bollinger Bands opened the gates for more volatility. Right now, Chainlink continues to bear a negative sentiment with MACD line hovering under the signal line and Awesome Oscillator indicating bearish momentum.

Chainlink had a market cap of $5.43 billion with a trading volume of $1.623 billion in the past day.

Bitcoin SV 

BSV 2
Bitcoin SV hourly chart

Bitcoin SV did clock in $249 on 1st August but hasn’t come close to that valuation in the past 3 weeks. Currently consolidating just $210, BSV is contradictory in terms of its market sentiment. Aroon Indicator was bearish at the moment but exhibited that a trend reversal might take place anytime.

Chaikin Money Flow of CMF suggested steady capital in-flows, meaning the asset remains pretty relevant. With a market cap of $3.89 billion, Bitcoin SV maintained its 8th position in the chart, registering a growth of 3 percent in the past day.

Filed Under: Altcoin News, News Tagged With: Bitcoin SV, chainlink, Ethereum (ETH)

Bitcoin at $10,000; “Psychological Resistance” No-More?

August 17, 2020 by Utkarsh Gupta

Over the years, the on-chain date for Bitcoin has become more and more useful. Just like traditional asset class (i.e. stocks, bonds, etc., etc.), historical information on the type of participants, market movements and other factors naturally made it possible for Bitcoin to develop further as an asset.

Now, since August, Bitcoin has been doing well to keep the price above $10,000, and a recent report suggests that a strong level of support for this range can be estimated.

OKEx Insights’ recent collaborated report with Catallact studied the behavioral pattern of Bitcoin and market sentiment of investors based on UTXOs.

Why is Bitcoin UTXO important?

For Bitcoin, UTXO is important because it allows the analyst to identify long positions of investors and their point of entry in the market.

Locations of UTXO buildups on the Bitcoin network

The chart above underlines an interesting difference between the two major clusters of UTXOs exhibited by the pink markers.

The first cluster arrived at the end of December 2018, when Bitcoin was at an absolute low valuation after the long crypto winter of 2018. It reflected that people were unconvinced that the price would no longer be higher.

Fast forward 2020, another major cluster can be observed, again under the resistance $10,000 but now investors were more positive, and they were willing to sit out the bearish pressure. So, the evolution of investor’s sentiment is largely evident.

After evaluation further changes in UTXO holdings in recent weeks realized and profit and losses, and spent output ratios, it was suggested that large positions in the Bitcoin have considerably moved above $10,000.

Before, a lot of the positions were accumulated between $6,000-$9,700, and after they were recently closed for profits, the downward pressure of Bitcoin has gradually decreased.

Realized profits and losses have also been tame during the recent bullish/bearish rally, indicating that maturity and optimism have been high on Bitcoin’s investor’s list. Additionally, the report added,

“The position buildup leading up to current levels (between $10K and $12K), coupled with the current mildness of profit-taking, indicates that these prices were deemed reasonable entry points by participants. It also indicates that those in profit are willing to hold their coins for larger gains in the future.”

Now, from the analysis, the point made was that Bitcoin might have reached strong support above $10,000 mark. With the price trailing that range for all these years, the solid foundation at $10,000 will positively equipped Bitcoin to march even higher.

Filed Under: Bitcoin News, News Tagged With: Bitcoin (BTC), bitcoin price

Ethereum: ETH Was Valued at $1042 When it Last Reached 1.24 Million Daily Tx.Count

August 17, 2020 by Utkarsh Gupta

The spotlight continues to be on Ethereum, as August is turning out to be an extremely price lucrative month for the largest altcoin. Since 1st August, Ethereum was registered all-time highs of three occasions, going step by step from $400 to $425 to $443. Although after clocking in $443, the asset has faced corrections, the overall trend remains extremely bullish right now.

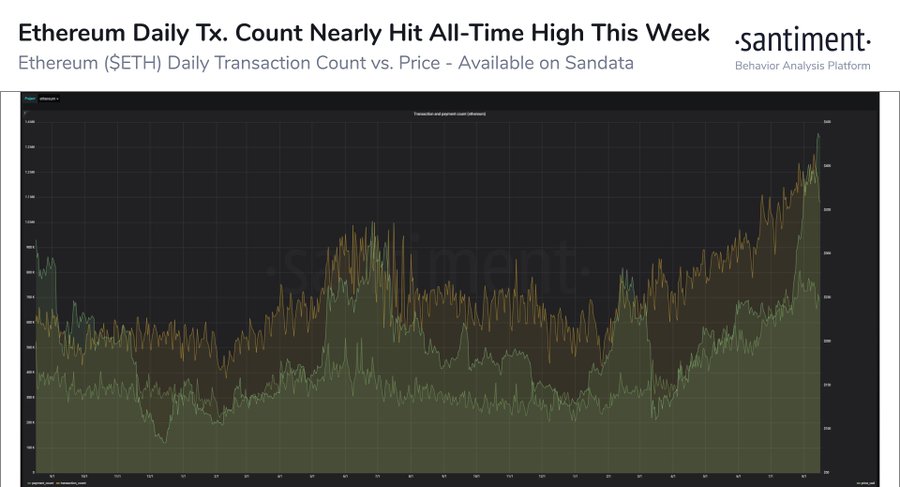
With respect to metrics as well, Ethereum’s fundamentals haven’t shied away from new heights. After registering a 20-month high hashrate in the charts, while transaction fees continued to run riots, Ethereum’s daily transaction count is now nearing an all-time high as well.

Image

According to Santiment’s recent data, the daily transaction count of Ethereum’s network is quite close to its all-time high in the charts. Back during the rally of late December 2017, on January 4th, 201 when Ethereum mustered a valuation close to $1042 the daily transaction count reached a high of 1.34 million addresses, and earlier this week, the count was closing at 1.27 million.

Additionally, the current transaction fee levied on Ethereum also clocked in two all-time highs in a row, with fees of 17.8k on 8th August, and 20.3k on 13th August. All the above data typically suggest high user activity but the truth might be something else well.

DeFi is inflating the system, not user activity?

As reported earlier, Ethereum’s active addresses are falling down the levels day by day when other metrics such as hashrate, miner revenue, and ether fees are going up.

That is largely contradictory in terms of equating a fixed factor on why Ethereum’s network is so over-utilized.

With a doubt, DeFi’s role is huge. Many are suggesting that Ether’s price growth is due to the explosive expansion of DeFi, as the protocols are leading the charts in terms of token transactions, interacting with other dApps, and the Ethereum network itself.

Ethereum options; the only clean sign of user activity?

skew total eth options open interest 1

Now, even though there is substantial doubt about the authentic user activity in Ehtereum’s network, the Open-Interest on Deribit exchange suggests that Ethereum is still a pretty sort out asset from an investment perspective. In a short time, from May 2020 to August 2020, Deribit’s ETH OI was risen by $200 million, and despite the congestion in the network, Ethereum’s continues to maintain a favorable stance with the investors.

Filed Under: Altcoin News, News Tagged With: ETH, Ethereum (ETH), Ethereum Options

Bitcoin Struggling at $12,000 is Only a Small Problem

August 17, 2020 by Utkarsh Gupta

Time and Time again, a resistance zone is seemingly getting attention from the community, which becomes Bitcoin’s immediate forward struggle. During the early period of 2020, The resistance set by $10,450 was considered the next big proving point, and right now, the tale is repeating with respect to the $12,000.

Bitcoin and Ethereum hit their yearly high of 2020 together during the last week of July and on the 1st of August. Since then, Ethereum has gone on to eclipse its $400 high, clocking in $423 at first, and then $442 over the past 24-hours. The same hasn’t been the case for Bitcoin, which was still under $11,900 at the time of writing this article.

However, the $12,000 resistance for Bitcoin was fundamentally more dependent on its macroeconomics than the momentum of a bull run, here’s why.

Bitcoin $12,000 will break because of retail and institution

A huge difference between Bitcoin rallies of the past to present is the fact that accredited players are involved in the BTC market at the moment. When Bitcoin dipped down to $11,000 on 2nd August, it was retail and institutional investors who were trying to buying the asset but a large portion of the market was selling as well.

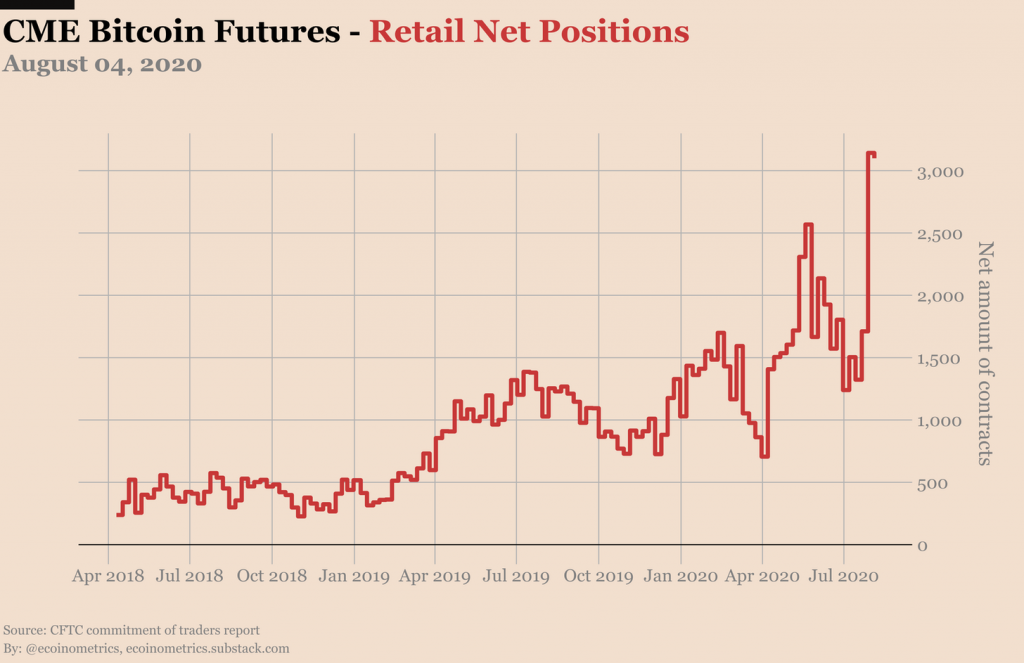
Now, according to a recent report, because of the increasing net position of the CME Bitcoin Futures(Retail), institutional investors were getting forced to play their hand as well in the market.

https bucketeer e05bbc84 baa3 437e 9518 adb32be77984.s3.amazonaws.com public images efa581ad 3505 4498 9fd8 f7a55f9e160a 3245x2101

The improved net position depicted in the chart is a prime example that the trend is moving between unassured investors, to the accredited ones. The report mentioned that over time, the “smart money” from institutions would flood into Bitcoin, raising the net position even more.

The strong fundamental thing attested to the current bullish rally is that investors were not selling off under bearish pressure. During the time of 2017, or mid-2019, when Bitcoin peaked at their highs, the correction was quick to follow because the potential was not evaluated well.

The Open-Interest is a great example of the increased interest. 2020 has seen multiple exchanges registering high all-time high OIs and there is with respect to lack of strong foundation.

2020 has already been a game-changer for Bitcoin. There is no doubt $12,000 will be breached soon as well because the narrative of this bullish rally is far more strengthened than any other rally over the past couple of years.

Filed Under: Bitcoin News, News Tagged With: Bitcoin (BTC), Bitcoin news, bitcoin price, btc news, erthereum

Ethereum, Bitcoin SV, Tron Technical Price Analysis on 16th Aug 2020

August 16, 2020 by Utkarsh Gupta

Volatility is completely locked in the cryptocurrency industry at the moment. Ethereum surged towards news new yearly high of $443 over the past day but other coins joined in the rally during ETH’s decline. The market altogether continued to picture a sense of divergence in the charts, like other altcoins continued to improve their standings in the ecosystem.

Ethereum 

Ethereum 1 horu e1597564571331
Ethereum hourly chart

As explained earlier, Ethereum reached another milestone on 15th August, reaching $442, just shy of the $450 mark. This is Ethereum’s third new high in 2 weeks, after clocking in $400 on 1st August. Ethereum had a market cap of $48 billion at the time of writing, with a trading volume of $11.8 billion.

However, Ether’s price fell prey to the volatile market as a quick decline has taken its valuation down to $427. Market Indicators were indicated strong bearish sentiments as well with CMF suggested that capital in-flows were getting outplayed by capital out-flows. Parabolic SAR also maintained its stance above the price candles and now, the Relative Strength Index is reaching an over-sold zone.

However, with the RSI a trend flipping might take place anytime soon.

Bitcoin SV

BSVUSD e1597564623771
Bitcoin SV hourly chart

With Bitcoin SV, the last 24-hours exhibited a decline of 4.14% but remain true to its week-long uptrend in the charts. For Bitcoin SV, the idea seemed simple as the moment with a consistent bounce off the uptrend and then pushing above the immediate support. With a market cap of $4.15 billion, Bitcoin SV was valued at $224.19 at press time.

Similarly to Ethereum, Bitcoin SV’s market confluence was a little bearish too. MACD signal line is trailing under the signal line, suggesting bullish strength in the charts. However, Parabolic SAR is bullish, staying put under the candlesticks and remaining at bay with the apparent long-term bullish rally.

TRON 

TRX 1 e1597564967591
TRON hourly chart

Lastly, Tron maintained its position in the 15th position with a market value of $1.83 billion. For the market cap, TRX tokens had a good trading volume of $809 million, and over the past day, the asset was up by 5.89%. With the parabolic SAR supportive of its rally, the other market indicators were waving a bull flag as well.

Awesome Oscillator suggested that the bullish momentum was slowly building up for Tron, and the MACD line was more often hovering above the signal line. Even though, the signal line was following at close proximity, at the moment bulls had the upper hand on Tron’s market.

Filed Under: Market Analysis, Altcoin News, News Tagged With: Bitcoin SV, BSV, ETH, Ethereum (ETH), TRON (TRX), TRX

Bitcoin, Bitcoin Cash, Litecoin Technical Analysis on 14th August 2020

August 14, 2020 by Utkarsh Gupta

Crypto market capitalization jumped to $20 billion in the industry after a flurry of bullish momentum took the entire market along with it to the top. Ethereum was a star performer, clocking a new yearly high of $433, but other assets were still able to take advantage of the rally.

Bitcoin completed its recovery from its last decline before $11,465, arching back above $11700. For Bitcoin Cash and Litecoin, the rally did not make a huge difference as the altcoins lacked the drive displayed by other top assets.

Bitcoin

bitcoin hourly chart
Bitcoin hourly chart

Bitcoin’s quick jump back from its recent low at $11,200 was reverse within a window of 48-hours in the chart. The assets price was currently picturing a crypto market capitalization of $217 billion, having risen by 2.08 in the charts.  With a volume of $17,46 billion over the past day, Bitcoin’s incline in the chart was back up a few market indicators.

Parabolic SAR for BTC is exhibiting a bullish trend as the indicator was hovering under the candlesticks. Relative Strength Index or RSI was also positive in the 1-hour time frame, allocating an incline, however, at press time, MACD has turned bearish. The orange marker line had completed a turnover with the blue MACD line, suggesting that bears might take charge of the price again.

Bitcoin Cash

BCH 3 e1597407622361
Bitcoin Cash hourly chart

For Bitcoin’s straight competitor in terms of functions, Bitcoin Cash did not take complete advantage of the recent rally. The asset was not able to complete its turnover with the $300 dollar resistance, and the token is currently valued just under, at $297. Bitcoin Cash’s market was worth above $5.48 billion and it continues to trail Chainlink in the chart, as LINK token recently surpassed BCH.

Although the asset wasn’t able to breach $300, Chaikin Money Flow indicated high capital in-flows for BCH, keeping the asset relevant during the trade.

Relative Strength Index or RSI was positive as well, with the index maintaining a higher buying pressure in the charts.

Parabolic SAR for BCH pressed on a continued bullish rally as well, indicating that $300 might still get breached over the next few days.

Litecoin 

LTC 1 e1597407652835
Litecoin hourly chart

Lastly, Litecoin registered a growth of 4.50 percent in the chart but just like Bitcoin Cash, there was a lack of control from the bull side. The asset was unable to the price above $60, stopping at $58 at top.

Now, Bollinger Bands for Litecoin indicated that the volatility might decline over the next few days as the bands appeared to converge, while Awesome Oscillator suggested that the tides were turning bearish.

The same sentiment was indicated by Parabolic SAR, where the dotted indicator appeared above the candles, hence Litecoin is possible heading towards a correction in the next few days.

Filed Under: Bitcoin News, Altcoin News, News Tagged With: Bitcoin (BTC), Bitcoin Cash (BCH), bitcoin hourly chart, crypto market capitalisation, cryptocurrency technical analysis, Litecoin (LTC), litecoin hourly chart

  • « Go to Previous Page
  • Page 1
  • Page 2
  • Page 3
  • Page 4
  • Page 5
  • Page 6
  • Interim pages omitted …
  • Page 20
  • Go to Next Page »

Primary Sidebar

Recent Posts

  • AAVE Price Prediction: Bullish Momentum Builds, $300+ Target in Sight May 25, 2025
  • Which 3 Picks Stand Among the Best Cryptos to Invest In Today Amid the Market’s Sharpening? May 25, 2025
  • PEPE Coin Jumps 1.52% as the Meme Token Indicates a Recovery May 25, 2025
  • Vitalik Buterin’s Node Overhaul Proposal For Ethereum To Propel PI Network And FloppyPepe For 40,000% Returns May 25, 2025
  • Ethereum Breakout? $4,035 in Sight if This Key Level Breaks May 25, 2025

Footer

News

  • Altcoin News
  • Bitcoin News
  • Blockchain
  • Tron News
  • World

Digest

  • Meet the Founder
  • Price Winning Article
  • DeFi
  • Cyber Security
  • Crypto Scam

Industry

  • Project Review
  • Technology
  • Fintech
  • Tron Exchange
  • New in Town

Tron Universe

  • Event and Tron Parties
  • New in Town
  • Tron Tokens

Follow Us

Subscribe US

Copyright © 2025 · Tron Weekly. All Rights Reserved. NOTE: Tron Weekly is an independent crypto news site that adheres to the strict journalism policy anchored on transparency, trust, and objectivity, we have no affiliation with the TRON Foundation, its founder Justin Sun or any other cryptocurrency firm.