• Skip to primary navigation
  • Skip to main content
  • Skip to primary sidebar
  • Skip to footer

TronWeekly

Crypto World News

  • Home
  • Education
    • Best TRON Wallets
    • Beginner’s guide to TRON
  • Opinion
    • Tron Tokens
    • Market Analysis
  • Industry
    • Tron Exchange
    • Project Review
  • Press Release
  • Advertise
  • About us
    • The Team
    • Editorial Policy
    • Write for us
    • Privacy Policy
    • Disclaimer
    • Terms and Conditions
    • Contact
You are here: Home / Archives for Utkarsh Gupta

Utkarsh Gupta

Ethereum’s 2-Year High of $433 Does Not Match its Network Growth

August 14, 2020 by Utkarsh Gupta

In 2020, Ethereum made a name for itself to surprise the community when they least expected a breakout.
On July 21, when Ethereum surged over $170, rising from $230 to $400, ETH proponents were on the verge of believing that anything could happen now. However, people in the crypto space tend to forget about the rally, and over the last 12 days, there has been enough speculation that the ETH rally has been done and dusted.

The largest altcoin managed to pull the rabbit out of the hat, yet again.

Witnessing a surge of 13.10 percent in the last 24-hours, Ethereum went passed its resistance at $400, attaining a high of $433. Right now, the valuation of Ether is at $425 as the altcoin is exhibiting consolidation.

While the Ethereum community rejoiced over the recent rally, metric-wise a lot was going in the network, which was not necessarily positive for the asset.

Ethereum hashrate on a 20-month High; but Daily Active Addresses low

Painting a picture of extreme contraction, it began with Ethereum clocking in a record hashrate of over 201 million GH/s, its highest network rate since mid-July 2018. Now, the increasing hashrate is a notable sign that the network is being used more and more, and activity should be reaching sky-high levels.

Miner revenue from fees and fee ratio multiple

A similar picture was created by the miner revenue, which attained its highest ever levels in Ethereum’s history. ETH miners were earning a profit of 18% on a 30-day average, which indicated the development of the space.

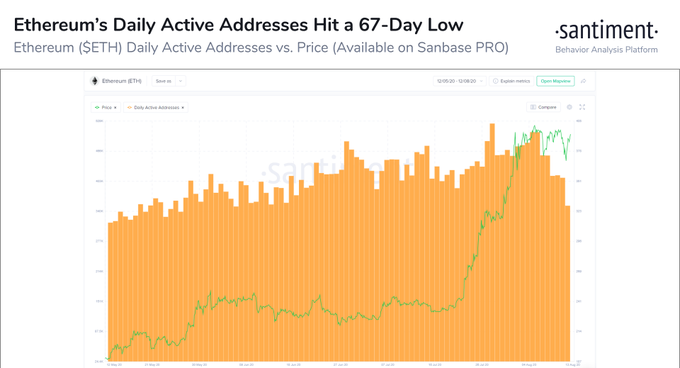
However, Santiment’s chart pictured the extreme opposite of high user involvement.

Image

The chart is a clear explanation that Ethereum’s network is not what it seems at the moment. According to the bar graph, Ethereum’s daily active addresses are on a 67-day low at the moment, recording only 350,000 addresses on 12th August. The network recorded such a low number back on June 7th, when ETH was priced under $250.

After the recent price surge, Santiment expressed its surprise as well. The analytics platform suggested,

🚀 Just a day after making a two-month low in address activity and fears of soaring fees, $ETH has defied the short-term fundamental concerns and soared to a 2-year high of $430! #Ethereum traders are rejoicing on sky-high social volume levels as well. 🎉 https://t.co/cRgCgaw4it pic.twitter.com/mndWglPl0T

— Santiment (@santimentfeed) August 13, 2020

Hence, it can be speculated that even though prices are soaring for Ethereum at the moment, they are legitimate holes in the network that does not match price development with ecosystem growth. On paper, Ethereum is undoubtedly the 2nd best crypto asset out there, however, the situation behind the curtains might be a little worse than expected.

Filed Under: Altcoin News, News Tagged With: Ether, Ethereum fees, Ethereum Price

Bitcoin Slips Below $11,300 But Majority of Bitcoin Miners Remain Profitable

August 13, 2020 by Utkarsh Gupta

Bitcoin’s price position in April 2020 was extremely critical. With the price hovering just under $7700-$8000, the main concern for several analysts was the capitulation of miners following the halving event. On 11th May, the block rewards of miners were cut short to 6.25 BTC per block and many expected BTC  to witness a bearish pullback after the halving. Mao Shixing, Co-founder of F2 Pool had stated,

“If the price of Bitcoin maintains at the current range of $6,000 to $7,000, more machines will inevitably be shut down after the halving. The March 12 crash has already caused a number of machines to shut down. But we may still try to improve their efficiency and reduce their costs.”

Luckily for Bitcoin, the rally over the past couple of months has been extremely fruitful as the digital asset recently went to register new year-highs.

With the price improving in the charts, miner profitability was on a high as well.

Bitcoin mining is once again profitable. pic.twitter.com/FTAinTKzcP

— Charles Edwards (@caprioleio) August 10, 2020

As revealed by Charles Edwards of capriole.io, Bitcoin production cost of electricity at the moment could be countered with BTC’s value at $7250 whereas Bitcoin was currently value way above, between $11,000 and $12,000.

However, despite mining being more profitable, according to recent data from Glassnode, miners seem to be getting a little anxious with the instability indicated by Bitcoin.

glassnode studio bitcoin transfer volume from miners to exchanges all exchanges 7 d moving average

As illustrated in the above chart, Bitcoin miner’s transfer volume from miner’s address to exchange address is steadily rising after dropping down to a new low back in June 2020. The transfer of volume from miner’s addresses to exchange indicated that some miners were possibly cashing out on their profits, hence necessarily conducting a certain level of capitulation. The 7-day moving average volume has almost doubled in the past couple of months, increasing from 170 BTC in June 2020 to 310 BTC on 11th August 2020.

It can be speculated that the current volatility pictured by Bitcoin is leading towards this uncertain stance of miners. If BTC does not surge anymore this year, cashing out at the top of a bullish rally is a logical step for most of the miners.

glassnode studio bitcoin net transfer volume from to miners all miners 7 d moving average

However, it is also worth taking note that that net volume between capital inflows and outflows in miner addresses remains in the green that means BTC coming into miners’ address is still more than BTC going out.

Hence, at the moment only a minority of miners might be going out of business while a majority of them continued to incurred more incoming Bitcoin volumes.

Filed Under: Bitcoin News, Altcoin News Tagged With: Bitcoin (BTC), Bitcoin miners, Bitcoin Mining, China

Ripple(XRP) Price Prediction: XRP has Necessary Momentum to Re-Test $0.30

August 12, 2020 by Utkarsh Gupta

With a 12.27% drop in the charts, XRP’s price position in the market was drastically altered over the past 24-hours. With Bitcoin witnessing a major pullback itself, some of the major altcoins were following the kingcoin’s path.

ripple’s market capitalization decreased to $12.49 billion at the time of writing, with a $2.2 billion trading activity clocked in during the crash.

XRP’s daily chart

XRP 1 e1597210608567

Even after accounting for a decline, ripple’s value was able to sustain a position between $0.310 and $0.284 in the charts. The vertical hike during the start of August is still evident and currently, the asset is projecting a positive pattern. The forming bullish pennant breaks out in a rally 56% of the time according to pattern analysis, which suggested that another rally is not out of the picture at the moment.

On 7th August, 50-day Moving Average also completed a Golden Cross over the 200-day Moving Average, which is a strong positive sign for the 3rd largest token. At the moment the major resistance and support are listed below:

Resistance 1: $0.284

Resistance 2: $0.310

Support 1: $0.266

Support 2: $0.246

XRP hourly chart

XRP 1 hour e1597210662892

The hourly chart of XRP still looks grim since the price continues to move between a descending channel. Currently, a bounced should arrive for the token at $0.269, is there is further collapse from $0.279. The last time XRP was below the support line of $0.269 dates back to August 1st, right before its rally up to $0.312.

With consistent trading volume supporting present movement, a definite trend is yet to arrive in the short-term chart. Hence, further clues are derived from the market indicators.

RSI MACD

Now according to XRP’s MACD signal, the trend is rather bearish at the moment with the orange line clearly dominating the bull line in the blue line in the chart. However, the blue line might conduct a reversal that will trigger XRP’s rally above.

In similar fashion to MACD, Relative Strength Index or RSI also suggested the same. Threading close to the oversold zone, buying pressure is bound to come back in the market over the next 24-48 hours.

Therefore, the next couple will be important for XRP’s next move in the industry.

Filed Under: Altcoin News, News Tagged With: Ripple (XRP), XRP daily chart, XRP hourly chart, xrp news today, XRP price analysis

Bitcoin: NASDAQ Listed-Firm Invest $250 Million in BTC as Part of “Strategic Allocation”

August 12, 2020 by Utkarsh Gupta

Over the past few hours, Bitcoin’s valuation stumbled down to $11,300, as the support line at $11,500 was briefly breached. With the price recovering back up to $11,375 at press time, it is fair to say that the asset is struggling at the moment.

Keeping that in mind, major organizations were hardly getting deterred as some of them saw huge potential in Bitcoin from a long-term scenario.

According to a report by Fortune, MicroStrategy, a Virginia-based business intelligence software organization, they have accumulated a whopping 21,454 bitcoins worth nearly $ 250 million. The business firm worth more than $1.2 billion, also listed on NASDAQ, indicated that the digital asset offered a  “reasonable hedge against inflation” and that, it was a “capital allocation strategy“.

With the dollar economy substantially weakening in 2020 due to the apparent Pandemic and consistent quantitative easing measure, Michael J. Saylor, CEO of MicroStrategy, indicated that they were currently turning their heads towards digital assets. According to him, the company believed that such “alternative investments” allow MicroStrategy to protect that U.S dollar-dominated balance sheet. He added,

“We find the global acceptance, brand recognition, ecosystem vitality, network dominance, architectural resilience, technical utility and community ethos of bitcoin to be persuasive evidence of its superiority as an asset class for those seeking a long-term store of value.”

The announcement inevitably gained attention from the Bitcoin community, and none other than Barry Silbert, CEO of Grayscale, responded on Twitter. Silbert conveyed,

https://twitter.com/barrysilbert/status/1293162827478335488?s=20

Such mainstream investment by a publicly traded firm unheard of in the markets of Bitcoin. Organizations with such credibility usually inject capital into bonds or stocks as part of a capital hedge strategy, so taking the route to Bitcoin only strengthens the legitimacy of the digital asset.


Willy Woo suggested Bitcoin is in Major bull phase

Although some of the people were lamenting on the short-term decline of Bitcoin, Willy Woo, popular crypto analyst, and Bitcoin proponent suggested that the digital asset is currently entering a major bull phase.

He suggested that 93.5% of the total Bitcoin supply is currently in profit hence, even though the price under a state of correction, it is all part of the long-term picture.

Previously, Woo had explained that the Bitcoin bull/bear cycle is triggered by the reduction of sell pressure after every 4 years post-halving. Since the beginning, the rally has become more and more stretched out, as the selling pressure from each halvening cycle continues to drop. Therefore, Bitcoin’s current 4-year cycle of the rally may eventually transcend into a traditional rally that may last 10 years.

Filed Under: Industry, Bitcoin News Tagged With: Bitcoin (BTC), Bitcoin news, digital asset, Micro-Strategy, Nasdaq, U.S Dollar

Bitcoin Below $10,000 was August 2019 Trend; is it Going to Repeat?

August 11, 2020 by Utkarsh Gupta

Bitcoin finally re-tested the resistance at $12,000 for the first time since 1st August a few hours back. The rally was short-lived with the king coin falling face forward to register a massive decline at support line $11,508. Credit to Bitcoin, the asset is above $11,900 again at the moment, but the largest virtual currency continues to swim in deep waters, suggesting a massive turnaround is coming, whether it is bullish or bearish.

Bitcoin hourly chart misses bearish break

BTC 1 hour e1597068818325

Now, Bitcoin‘s sideways movement between the range $11,508 and $12,000 has been observed since 5th August but the fact that the recent bearish pattern register rise is concerning. As witnessed, a descending triangle for Bitcoin underwent a bullish breakout instead of a bearish pullback below support line $11,508, which indicated irregularity in the market. Now, with the price floating in the high range, a key pattern was observed between the price activity of August 2019 and August 2020.

Will Bitcoin repeat the bearish pullback of August 2019?

BTC 2 e1597068869127

In the comparison chart above, a side-by-side analysis is drawn between Bitcoin’s price movement in August 2019 to BTC’s move in August 2020. Co-incidentally the price position of Bitcoin is at the exact same place right now, as it was back in 2019.

The rally before reaching $12,000 is very similar breaching past the same resistance in the charts. Now, something which is not uncommon in the market can pull back Bitcoin below $10,000 over the next week. If Bitcoin’s trend of 2020 completely mirrors the price movement of 2019, the coin will drop down to $9700 in the market.

The decreasing trading volume at the time of writing might be a red flag, indicating that the rally over the past one week is not strong, and based on weak trading fundamentals.

With high volatility exposure, a massive decline is certainly not out of question for Bitcoin as BTC’s price continues to struggle with the  $12,000 range.

Filed Under: Bitcoin News, News Tagged With: Bitcoin (BTC), Bitcoin [BTC/USD] Price Analysis

Bitcoin SV,Ethereum,Tron Altcoin Technical Analysis on 10th August 2020

August 11, 2020 by Utkarsh Gupta

Volatility has been strongly exposed in the cryptocurrency market in the month of August, which has resulted into large-cryptos surging and dumping slightly on the charts. During such high volatile period, coins were contributing to sideways movement and at the time of writing, many of these assets were unsure of the trend to follow. mentioned below the Bitcoin SV, Ethereum Tron hourly charts

Ethereum hourly chart

ethereum analysis

Second only to Bitcoin, Ehtereum is currently reporting 1.63 percent of the chart gains, which is accompanied by a market cap of $44.38 billion. Noting the price of $395 at the moment, Ethereum ‘s movement has remained strictly between $385-$400 since its collapse on 2 August.

Ethereum’s Relative Strength Index is currently indicating higher buying pressure but it was not definite. There is a possibility for the sellers to take charge as well. However, Parabolic SAR suggested that a bearish trend is currently active for the largest altcoin as the dotted indicator is hovering over the candlesticks.

Bitcoin SV hourly chart

bitcoin SV analysis

Bitcoin SV recently lost its 6th place in the chart to rising Chainlink token as the BTC hard-fork coin registered gains of 1.25%. For Bitcoin SV, a downtrend can be observed as the price continued to decline from resistance at $242, towards support line $218. In the meantime, Bollinger Bands for BSV suggested a reduced volatile period in the future.
With a market capitalization of $4.19 billion, Bitcoin SV incorporated a strong trading volume of $1.31 billion but Parabolic SAR suggested a bearish trend for the token.

However, Chaikin Money Flow is currently hovering over the zero-line, making sure that the capital coming in is outperforming the capital going out in the charts.

TRON hourly chart

trx analysis

Lastly, For Tron, the market is more bullish than the rest of the aforementioned altcoins. At first glance, a strong uptrend can be pictured in the charts for TRX as the asset surged by 5.74% over the last 24-hours. Market Capitalization of the 16th ranked asset is $1.55 billion with an average trading activity of $550 million.

All the market indicators are currently positive for Tron’s short-term future. Starting with MACD, the blue line was pictured above the orange line suggestive of a bullish rally in the charts.

Awesome Oscillator also indicated strong bullish momentum for the token and Parabolic SAR remains under the candlesticks completing the array of green-lighting buy signals.


Disclaimer: The presented information is subjected to market conditions and may include the very own opinion of the author. Please do your ‘very own’ market research before making any investment in cryptocurrencies. Neither the writer nor the publication (www.tronweekly.com) holds any responsibility for your financial loss.

Filed Under: Altcoin News, News Tagged With: bitcoin analysis, Bitcoin SV (BSV), cryptocurrency analysis, ethereum analysis, Ethereum(ETH), TRON (TRX), trx analysis

Bitcoin Cash, Litecoin, Chainlink, Technical Analysis on 8th August 2020

August 9, 2020 by Utkarsh Gupta

The digital asset industry is not under a cohesive bull rally anymore. Over the past week, major crypto assets have been observed to follow their own trends in the charts. With Bitcoin recently rising above $11,500, altcoins’ response in the market was rather timid. With doubts over a bull market continuing to fade, Bitcoin, Litecoin, and Chainlink’s market were evaluated to understand industry patterns.

Bitcoin Cash

BCH 2 e1596893288499

With Bitcoin Cash, the common consensus in the market is that it follows Bitcoin in the charts. However, whereas Bitcoin has surged 1.12% over the past day, BCH entertained a decline of 3.32% The forked BTC crypto exhibited a market capitalization of$5.7 billion as the price of token remain at $308.

For Bitcoin Cash, the MACD line is bullish at the moment but as the orange line closes in, there is a chance the bears will dominate the market in the near future. Awesome Oscillator also suggested diminishing momentum for the bulls at the time of the press.

In the meantime, Bollinger Bands appeared to converge, so volatility might fall for the BCH token going forward.

Litecoin 

LTC e1596893316229

Litecoin is another token facing the bears at the moment. Although the Parabolic SAR indicator appeared to be bullish for Litecoin, Relative Strength Index or RSI is on a decline with respect to the price. Litecoin is valued at $58.42 but its trading volume shows active interest with $2.29 billion. Market Capitalization for LTC is $3.81 billion.

With capital coming in dominating capital going out, according to the CMF indicator, there is a chance Litecoin will be reversing its trend in the short-term. For Litecoin, the support is currently at $54 and the resistance is just above $60.

Chainlink

LINK e1596893343607

Clocking in the best performance in the market for the day, Chainlink seems to be on its own bullish trend since the start of July. the growth of LINK tokens has been commendable as the asset recorded a 7.74% jump in the past day.

LINK also reached $10 in the charts, after being worth under $5, just a few weeks ago. The chart in the above analysis indicated a market on the rise for LINK. Aroon indicator is estimating a bullish momentum in the chart, with CMF confirming the growth of capital coming in. Lastly, Parabolic SAR maintained position under the candlesticks, with the bulls taking charge of LINK’s price.

Filed Under: Altcoin News, News Tagged With: Bitcoin Cash (BCH), Chainlink (LINK), Litecoin (LTC)

Ethereum: Vitalik Buterin Dragged into Debate; ETH Supply in Question

August 9, 2020 by Utkarsh Gupta

Underneath the current bull rally, which has led to new yearly highs for Bitcoin and Ethereum, another heated spat is taking place in the ever-active Twitter-sphere. Ether supporters or “Ethereans,” as they say, clash their heads with bitcoin maximalists.

None other than Vitalik Buterin is in the middle of the current conundrum, and the topic of the current argument has been the circulating supply of ETH.

Ethereum’s transaction has skyrocketed exponentially in the past week, leading to a point that Bitcoin proponents have started to accuse Ethereum ‘s ecosystem of being a hotbed of various Ponzi schemes.

A popular Bitcoin maximalist, Udi Wertheimer brought an old incident into the picture from August 2010, when a bug in BTC’s client allowed a specific node to validate an invalid block containing around 92,233,720,368 Bitcoins. Although back then the problem was solved in no-time, Wertheimer, took his shot at Ethereum by stating,

“If it happened in Ethereum, no one would know! Maybe it already happened!”

With the fire already ignited, other Bitcoin maximalists jumped on board and Pierre Rochard indicated the fact that the current supply of Ethereum is actually not known.

With the BTC community piling up on Ethereum’s supposedly shorting-coming, Vitalik Buterin responded. The Ethereum Co-Founder stated,

Because we roughly know what it is according to the protocol rules, and we know that there's so many people running different implementations that a bug would get caught?

— vitalik.eth (@VitalikButerin) August 8, 2020

Now, in hindsight, his response missed putting a nail in the coffin of this argument, as quoting “roughly” was interpreted as in a suspicious manner as well.

However, a software developer from MakerDao, Marc-André Dumas, pictured a bit of clarity in support of Ethereum. Responding to Rochard on Twitter, Dumas suggested after running his code on a quick script to compute the total eth supply, the result was pretty close to the number exhibited by etherscan.io.

Multiple metrics platforms such as Messari, Coingecko, and CoinMarketCap were all suggesting a similar circulating supply that was around 112,000,0000.

Hence, for the time being, the debate seems to be over, but it is never really over between the community members of Ethereum and Bitcoin.

Filed Under: Altcoin News, News Tagged With: Bitcoin (BTC), Bitcoin news, Ethereum (ETH), Ethereum news, Vitalik Buterin

U.S Crypto: 72% of North America Favors Bitcoin; Only 11% Activity in Altcoin

August 8, 2020 by Utkarsh Gupta

The United States of America is undoubtedly one of the most active regions in the world in terms of cryptocurrency traffic. Although regulatory wise, the U.S government‘s stance is still not clear on crypto assets, volume-wise, U.S is one of the largest active nations.

Now, according to Chainalysis’s recent report, the North American region is only 3rd in the world in terms of crypto trading volume, behind the markets facilitated in East-Asia and Western Europe. U.S based addresses accounted for 14.8% of all crypto activity in the past 12 months and the report indicated that its market had an “extremely active” professional market. What it meant was that the transactions taking place in and out of the U.S were not for small amounts of capital.

5f2b35e712af6b74e16464e3 f2BYlnuKcfIoeebqgoOUEtACf1mWo6t0jvAIuY836EtmKQ9iUVqI sbCjZtxckfFurzGBeUeXVBj7MfJ1I8DlYnfHriNAPNvFJmQ keHkWZQSYfn hbSH5RG9lhgNN acptPFpva

As suggested in the above illustration, 90% of U.S digital assets transfer came from professional traders, which chainalysis categorizes as transactions worth over $10,000. The report added,

“Starting around December 2019, the share of North America’s total value transferred made up of transfers above $1 million rises from 46% to a high of 57% in May 2020. That corresponds with the jump in the overall professional market share of North America activity rising from 87% in December 2019 to a high of 92% in May 2020.”

Institutional Investors interest growth in the U.S

Aside from an active professional market, the growth of Institutional investors has also been gaining traction in the market. Fidelity Investments June 2020 survey listed that out of 800 accredited investors across the United States and Western Europe, around 36% were involved in digital currencies. The rest of the investors indicated their intrigue as well, with many suggestive that they could potentially add cryptocurrencies to their portfolios.

Fidelity’s very own Digital Assets Platform is also currently active in assisting institutional investors with their demand and crypto custody.

Bitcoin remains the most popular, followed by Stablecoins

Without a surprise, Bitcoin remains the poster boy of digital assets, as every major region involved with digital assets, were dominated with Bitcoin activity over other assets.

Surprisingly, Stablecoins took the 2nd place in the charts outperforming the huge collective of altcoins in the U.S market. The report added,

“Bitcoin makes up the biggest overall share of North American cryptocurrency activity, accounting for 72% of all transaction volume. Altcoins (not including stablecoins) make up just 17% of activity in North America, compared to 33% in East Asia.”

Filed Under: Industry, News Tagged With: Bitcoin (BTC), Chainalysis, Crypto, crypto us, Institutional Investors, U.S, u.s cryptocurrency, us bitcoin

Is Ethereum’s $400 Resistance Becoming Weak or Becoming a Problem?

August 7, 2020 by Utkarsh Gupta

Ethereum’s rapid hurrah towards $400 is quickly becoming a price point of concern for its supporters. After Ethereum clocked in above the range of 1st August, ETH bulls were deliriously delighted. They hoped that this is the beginning of Ethereum’s long-awaited bullish rally which will take them above the elusive $1000 price again. The sentiment dropped down quite a notch since the 1st day of the month.

Ethereum daily chart

ETH tron e1596724190836

At the time of writing, Ethereum’s value has maintained a close trading range, encapsulated under an ascending channel pattern. The problem with the above pattern is that it carries bearish implications for the future. As Ethereum appears to struggle under the $400 range, a legitimate argument can be made that the asset made has reached a dead-end for the time being. Moving Average is maintaining an active support but the bullish momentum is slowly tapering down.

Sellers can be expected to come back anytime at the moment as the Relative Strength Index might move from a position of strength to a position of weakness very fast. MACD also suggested that a possible trend reversal should be expected as the orange line appeared to enter a cross-over with the blue line.

Eth tron 4 hour e1596724225428

However, the concerns were not over yet.

Ethereum’s 4-hour chart did not paint a pretty picture either as the coin appeared to exhibit a rising wedge pattern. A bearish pullback is usually expected from such situations and a drop down to $381 cannot be taken out of consideration.

In the meantime, the dropping trade volume is the biggest red-flag. With the price rise over the past week, Ethereum’s trade volume has continued to dip, indicating the creation of a bearish divergence. Now, such market conditions lead to weak rallies on top and eventually resulting in a massive price drop towards the bottom.

Ethereum’s $400 is weakening, according to Expert

Now, with the above data condoning towards a bearish forecast, not everyone was buying into the negative perspective. For popular crypto trader, Michael Van Poppe, ETH’s resistance at $400 appeared to weaken over the past week.

He tweeted,

$ETH #ETHEREUM

Well, closed my short at break.

Let's see how this plays out.

Held the crucial support level & flipped the intermediate level for support + attacking the resistance.

Break of resistance = leading towards new highs, I'd assume. pic.twitter.com/AmJpiu40WK

— Michaël van de Poppe (@CryptoMichNL) August 5, 2020

With Poppe expecting new highs in the market, it will be interesting how the market turns out over the next couple of weeks. For Ethereum bulls, another rally above $400, and eventually crossing $500 will be huge. However, if the largest altcoin is hit with another strong period of correction, the bull run could be over for Ethereum for the quarter.

Filed Under: Altcoin News, News Tagged With: Ethereum (ETH), Ethereum 2.0, Ethereum Price

  • « Go to Previous Page
  • Page 1
  • Interim pages omitted …
  • Page 3
  • Page 4
  • Page 5
  • Page 6
  • Page 7
  • Interim pages omitted …
  • Page 20
  • Go to Next Page »

Primary Sidebar

Recent Posts

  • AAVE Price Prediction: Bullish Momentum Builds, $300+ Target in Sight May 25, 2025
  • Which 3 Picks Stand Among the Best Cryptos to Invest In Today Amid the Market’s Sharpening? May 25, 2025
  • PEPE Coin Jumps 1.52% as the Meme Token Indicates a Recovery May 25, 2025
  • Vitalik Buterin’s Node Overhaul Proposal For Ethereum To Propel PI Network And FloppyPepe For 40,000% Returns May 25, 2025
  • Ethereum Breakout? $4,035 in Sight if This Key Level Breaks May 25, 2025

Footer

News

  • Altcoin News
  • Bitcoin News
  • Blockchain
  • Tron News
  • World

Digest

  • Meet the Founder
  • Price Winning Article
  • DeFi
  • Cyber Security
  • Crypto Scam

Industry

  • Project Review
  • Technology
  • Fintech
  • Tron Exchange
  • New in Town

Tron Universe

  • Event and Tron Parties
  • New in Town
  • Tron Tokens

Follow Us

Subscribe US

Copyright © 2025 · Tron Weekly. All Rights Reserved. NOTE: Tron Weekly is an independent crypto news site that adheres to the strict journalism policy anchored on transparency, trust, and objectivity, we have no affiliation with the TRON Foundation, its founder Justin Sun or any other cryptocurrency firm.