• Skip to primary navigation
  • Skip to main content
  • Skip to primary sidebar
  • Skip to footer
  • About TronWeekly
  • Write for us
  • Terms and Conditions
  • Privacy Policy
  • Disclaimer
  • Contact
  • All Posts
  • Advertise

TronWeekly

Crypto World News

  • Home
  • Latest News
  • Opinion
    • Education
    • Best TRON Wallets
    • Beginner’s guide to TRON
    • Tron Tokens
    • Market Analysis
  • Industry
    • Tron Exchange
    • Project Review
  • Press Release
  • Bitcoin (BTC)
  • Ripple (XRP)
  • Advertise
  • About TronWeekly
    • The Team
    • Editorial Policy
    • Write for us
    • Privacy Policy
    • Disclaimer
    • Terms and Conditions
    • Contact
You are here: Home / All Posts

All Posts

Zerohash Fund Seeks New Valuation Above $1.5 Billion After Mastercard Exit

By Bena Ilyas | Edited By Messam Raza,May 20, 2026, 9:00 AM

Crypto infrastructure company Zerohash is planning to raise new funds via the Zerohash fund initiative at a valuation exceeding $1.5 billion amid reports that payments giant Mastercard decided to pull out of investing in the company. The news follows a recent shift in Mastercard’s focus towards acquiring BVNK after completing the $1.8 billion BVNK acquisition deal.

Zerohash is currently looking to raise funds amid increasing interest among institutional investors to invest in crypto infrastructure companies. The company offers infrastructure services to power crypto trading, stablecoin payments, settlement, and tokenization of assets for fintech companies, brokerages, and financial institutions that wish to use regulated blockchain services.

🤔 Zerohash Seeks New Funding at Over $1.5 Billion Valuation After Mastercard Drops Investment Plans#Crypto infrastructure firm Zerohash is pursuing a new funding round at a valuation exceeding $1.5 billion. This comes after Mastercard abandoned plans to invest in the company…

— CryptOpus (@ImCryptOpus) May 19, 2026

Also Read | Bitcoin Mining Crisis Deepens as Canaan Posts $88.7 Million Loss in Q1 2026

Mastercard Changes Strategy After BVNK Acquisition

Earlier this year, Mastercard was reportedly considering investing in Zerohash despite failed discussions for an acquisition deal between the two companies. Reports at the time suggested that Mastercard had considered the Zerohash fund to be valued at nearly $2 billion when negotiations ended and the payments giant focused instead on acquiring BVNK.

The acquisition of BVNK seems to have changed Mastercard’s approach to building its crypto infrastructure portfolio and has seen the company opt to acquire the relevant infrastructure rather than make minority investments in other companies. Mastercard has yet to make any official comments regarding reports about the halted investment negotiations.

At the same time, Zerohash is continuing discussions with new investors with regard to raising additional funding at valuations that exceed previous funding rounds. Mastercard has continued to develop its stablecoin programs through collaborations and blockchain settlement initiatives around the world. Mastercard revealed a partnership with Yellow Card to develop stablecoin payment solutions in Eastern Europe, the Middle East, and Africa.

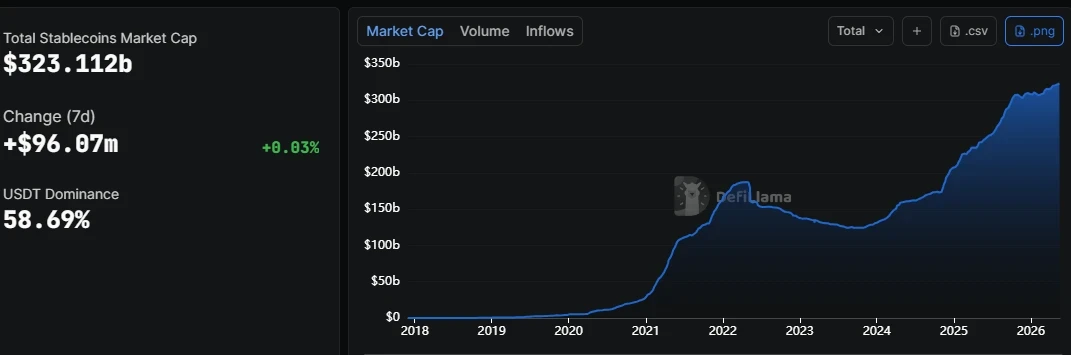
Meanwhile, the stablecoin market capitalization currently stands at $323.11 billion, marking a remarkable 130% increase since 2024. This expansion has been driven primarily by improving global regulatory clarity and accelerating mainstream adoption.

stablecoin market capitalization
Source: DefiLIama

Mastercard’s strategic move positions the company to capture a larger share of rapidly growing, 24/7 programmable payment flows without binding users to closed, proprietary ecosystems.

Institutional Demand Strengthens Zerohash Fund Growth Momentum

Zerohash was founded in 2017 and offers APIs and embedded infrastructure that enable banks, brokerages, and fintech companies to provide crypto trading and tokenization services. Among the clients of Zerohash are Morgan Stanley, Stripe, BlackRock, and Franklin Templeton, with the company serving more than five million customers across 190 countries.

The Zerohash fund has gained traction among institutional investors amid increased confidence in blockchain infrastructure providers due to the growing adoption of regulated digital assets in traditional financial markets. Zerohash fund’s last valuation came in at $1 billion following the completion of a $104 million Series D-2 funding round in September 2025 that was led by Interactive Brokers.

Investors in the series included SoFi and funds managed by Apollo Global Management. As the Zerohash fund proceeds with the new funding round, the valuation trajectory of the company remains closely watched by the market.

Also Read | XRP Breakout Prediction: Is a $15 Run Really Coming?

Filed Under: Cryptocurrency News

TRX Price Analysis: Strong Uptrend Signals Breakout Above $0.3680

By Usman Zafar | Edited By Ammar Raza,May 20, 2026, 7:30 AM

TRON (TRX) shows strong bullish momentum as buyers maintain control and trend upward. Resistance is being tested, with potential breakout signaling further gains for the TRX price. Overbought conditions hint at possible short consolidation, while continued accumulation supports a longer-term positive outlook.

At the time of writing, TRX is trading at $0.3554 with a 24-hour trading volume of $667.01 million and a market capitalization of $33.7 billion. Despite showing signs of stability over the last 24 hours, the technical indicators and institutional accumulation point to a strong breakout for TRX.

TRX Price chart

Source: CoinMarketCap

TRON Price Eyes Bullish Break to $0.3680 Resistance

According to the crypto analyst Crypto Tony, the TRX price continues to show strong relative performance as buyers maintain control across recent sessions. 

The TRX price action remains structured within an upward range, signaling steady accumulation rather than distribution. Market participants are now watching the $0.3680 resistance zone closely, which represents a key barrier. A breakout above it could trigger further bullish continuation momentum soon.

TRON Price Eyes Bullish Break to $0.3680 Resistance

Source: Crypto Tony’s X Post

Despite short-term fluctuations, TRX remains one of the stronger-looking altcoins, with market structure favoring bulls as long as higher support levels hold. 

If the TRX price breaks and sustains above $0.3680, momentum could accelerate toward new range highs, while rejection may lead to temporary consolidation before another attempt at upside expansion in the upcoming trading sessions.

Also Read: TRX Price Prediction: Bullish Breakout Signals Potential Rally Toward $0.38

Technical Indicators Reinforce Bullish Momentum

According to TradingView, the TRX price has had a robust bullish recovery since hitting bottom at $0.2700 in February. 

So far, the TRX price is up to $0.35559, which means that there is a distinct bullish pattern formed by the key moving averages. This is an indication of solid buying pressure as the TRX price rallies towards its previous high levels.

TRX Technical Indicators Reinforce Bullish Momentum

Source: TradingView

Technically, there is an indication that strong momentum is pushing into an extremely extended territory. The 14-period RSI is overbought at 77.72, suggesting potential exhaustion. 

While buyers remain in control, a brief period of consolidation or a retracement back to the 20 EMA support level of $0.33282 seems more likely.

Tron Inc. Continues TRX Accumulation Strategy

The data from Tron Inc. further highlighted that the company has diversified its digital asset investment by acquiring 140,354 TRX tokens for an average price of $0.3562. 

The acquisition of these assets in the current market is reflective of the company’s ongoing efforts to gradually increase its investment portfolio while remaining engaged with the Tron platform.

Tron Inc. Continues TRX Accumulation Strategy

Source: TRONSCAN

By making this injection, Tron Inc., which already holds more than 696.6 million TRX coins, is reinforcing its long-term strategy for building up its digital assets. 

The firm continues to maintain TRX holdings as an integral part of its efforts to increase shareholder value through alignment of its own reserves with Tron’s development.

This article contains market analysis and price predictions. These are not guarantees. Crypto markets are volatile. Always DYOR. Not financial advice.

Also read: TRX Price Surges as Institutional Buying Grows: Is $0.47 the Next Target?

Filed Under: Cryptocurrency News

DASH Price Accumulation Signals Potential Breakout Above 2021 High

By Usman Zafar | Edited By Ammar Raza,May 20, 2026, 7:00 AM

The DASH price is moving within a broader accumulation phase, suggesting possible further base building before a breakout. Momentum indicators hint at short-term bullishness, but overall consolidation remains. Neutral RSI and declining volume and open interest signal caution, while long-term structure supports potential future upside.

At the time of writing, DASH is trading at $42.66 with a 24-hour trading volume of $89.54 million and a market capitalization of $541.85 million. Following the 1.42% surge over the last 24 hours, DASH is poised for the break toward new highs with improved momentum.

DASH Price chart

Source: CoinMarketCap

DASH Falling Wedge Setup Targets Break Above 2021 High

Furthermore, the crypto analyst Crypto Bullet pointed out that the DASH price structure indicates a developing macro rounding bottom with a nested falling wedge, suggesting long-term accumulation after the prior cycle’s decline. 

The DASH price action may still revisit the $20–$25 support zone, acting as a final liquidity sweep before trend resolution. Such behavior often precedes broader bullish expansion in late-stage accumulation phases over extended broader market cycles.

DASH Falling Wedge Setup Targets Break Above 2021 High

Source: Crypto Bullet’s X Post

Long-term projection suggests continued base-building through 2028/2029, with eventual breakout potential above the 2021 cycle high if the multi-year structure completes as expected. 

This marks a full transition from accumulation to expansion and confirms a structural shift in market regime driven by sustained demand and macrocycle recovery conditions over an extended crypto cycle phase upward.

Also Read: DASH Price Prediction: Bulls Target $50 as Structure Turns Positive

Momentum Indicators Point to Bullish Shift

According to TradingView, the MACD is suggesting that an upward trend is emerging for the DASH price, with the blue line crossing above the orange signal line at levels -0.25928 and -0.51970, respectively. 

The histogram follows the same movement, becoming positive at 0.26042. However, considering that both lines are still below the zero level, the DASH price outlook is quite fragile.

DASH Momentum Indicators Point to Bullish Shift

Source: TradingView

The RSI indicator is trading within a neutral range, being at 50.16 and balanced on the borderline of overbought and oversold levels. The indicator slightly surpasses the level of its yellow moving average of 44.88, indicating that the asset is recovering from its drops at $41.00. There are no overbought levels detected.

DASH Derivative Data Point to Cautious Optimism

Additionally, open interest in Dash fell by 1.07% to stand at $59.97 million. The slight fall in the open interest indicates lower numbers of derivatives being held, implying lower activity levels and reduced participation in the market.

DASH Derivative Data Point to Cautious Optimism

Source: Coinglass

However, there has been a decline in the trading volume by 31.87% to $86.73 million, which implies less participation in the market. This trend suggests that the momentum is fading and there have been fewer trades in the market, particularly when compared with previous periods.

This article contains market analysis and price predictions. These are not guarantees. Crypto markets are volatile. Always DYOR. Not financial advice.

Also Read: DASH Price Could Surge Toward $143 if Bulls Maintain Key Support Level

Filed Under: Cryptocurrency News, Altcoin News

JASMY Price Prediction: Fractal Setup Hints at a Rally Toward $0.055

By Usman Zafar | Edited By Ammar Raza,May 20, 2026, 6:30 AM

JasmyCoin (JASMY) is forming a fractal structure similar to a previous breakout phase, suggesting potential for a strong directional move. However, the JASMY price action shows bearish pressure after a failed rally, with indicators signaling weakness. Rising trading activity and open interest still point to sustained market engagement and possible volatility.

At the time of writing, JASMY is trading at $0.005546 with a 24-hour trading volume of $312.55 million and a market capitalization of $274.24 million. After posting the 1.61% decline, everyone’s focus is now on whether the token maintains its bullish trajectory or weakening technicals lead to deeper levels.

JASMY Price chart

Source: CoinMarketCap

JASMY Fractal Signals Breakout Toward $0.055

Furthermore, the crypto analyst Crypto Chiefs revealed that the JASMY price is drawing renewed attention from traders as chart watchers highlight a repeating fractal structure similar to its 2023 breakout phase. 

That earlier pattern saw extended consolidation before a sharp rally toward $0.055, fueling speculation that the current tightening wedge may again be signaling a major directional move from long-term support.

JASMY Fractal Signals Breakout Toward $0.055

Source: Crypto Chiefs’ X Post

Analysts note that the JASMY price is now compressing within a similar multi-month structure, with price action holding a long-term support channel and volatility narrowing. 

If history rhymes, a breakout above resistance could trigger another momentum-driven expansion toward the $0.055 for the JASMY price, though outcomes remain uncertain and depend heavily on broader crypto market conditions and risk-sentiment shifts.

Also Read: JASMY Price Prediction: Bullish Structure Points to a Rally Toward $0.0099

Technical Indicators Point to Downward Pressure

According to TradingView, the JASMY price started the month of May by witnessing an incredible rally to nearly reach the $0.00780 level and breaking above the upper Bollinger band. 

However, the JASMY price rally could not be sustained for too long, and soon after, it started pulling back significantly. The series of red candles has taken the price to the $0.00554 level, below the 20-day SMA.

JASMY Technical Indicators Point to Downward Pressure

Source: TradingView

From the technical analysis, it is clear that there is a bearish takeover on the JASMY price. The Bollinger Bands had expanded to a great extent at the time when the price was at its highest level, but now, it is sliding downwards towards the lower bands at $0.00494. The MACD line has crossed below the signal line, while the histogram bars are growing bigger.

JASMY Derivative Data Point to Increasing Strength

However, the JASMY open interest rose slightly by 3.77%, hitting $19.79 million. This indicates that there is a slight increase in the number of derivative contracts, showing that the traders are participating actively in the market while waiting for a price change in the near future.

JASMY Derivative Data Point to Increasing Strength

Source: Coinglass

The volume shot up by 117.16% to $56.34 million, suggesting that there is increased trading activity in the market. This could be interpreted as increased interest from the market participants, hence the possibility that the volatility will increase as the traders react strongly to the price movements.

This article contains market analysis and price predictions. These are not guarantees. Crypto markets are volatile. Always DYOR. Not financial advice.

Also Read: JASMY Price Analysis: Breakdown Below Key Levels Signals Downside Risk

Filed Under: Cryptocurrency News, Altcoin News

NEAR Price Analysis: Strong Breakout Above $1.60 Fuels Hope for a $2 Rally

By Sadia Ali | Edited By Ammar Raza,May 20, 2026, 6:00 AM

NEAR Protocol (NEAR) is showing an upward potential as buyers maintain control and the NEAR price structure points to upward. Momentum remains bullish with rising participation and derivatives activity, while technical indicators suggest continued upside potential. However, short-term consolidation is possible as conditions approach overbought levels.

At the time of writing, NEAR is trading at $1.66 with a 24-hour trading volume of $312.55 million and a market capitalization of $2.14 billion. After the 8.42% surge over the last 24 hours, the NEAR points to a strong breakout as key support holds strong.

NEAR price chart

Source: CoinMarketCap

NEAR Price Holds Strong Above $1.40 With $2 in Focus

Furthermore, the crypto analyst Michaël van de Poppe revealed that NEAR has shown strong resilience in a volatile crypto market, holding up well despite broader corrections. 

The NEAR price action remains firm and is gradually recovering toward higher levels. The key technical zone sits at $1.40, and as long as this level holds, continuation remains the primary bias with buyers actively defending structure.

NEAR Price Holds Strong Above $1.40 With $2 in Focus

Source: Michaël van de Poppe’s X Post

If momentum continues, a retest of $2.00 becomes a realistic target supported by improving fundamentals and ecosystem growth. 

Rising network revenue and the expansion of NEAR Intents, which enables intent-based cross-chain execution and smoother user interactions, add strength to the bullish narrative for the NEAR price. Together, technical stability and utility growth support further upside potential.

Also Read: NEAR Protocol Price Could Explode Toward $4 After Major Recovery Signal

Technical Indicators Reinforce Upward Potential

According to TradingView, the NEAR price is making a strong bullish reversal signal. Following its consolidation at the level of 0.95000, the NEAR price has managed to make a solid climb with rising bottoms. 

The 200-day EMA is broken, with the price jumping from 1.59914 to 1.67620. This significant breakout above major MAs proves that the bulls are clearly dominating the market.

Technical Indicators Reinforce Upward Potential

Source: TradingView

In addition to this positive price action, the RSI indicator shows bullish momentum. Currently, it stands at 68.37, which is higher than the signal line of 64.64, suggesting aggressive buying pressure. 

However, since the RSI indicator is inching closer to the overbought level of 70.00, it may soon consolidate or correct itself.

NEAR Derivative Data Point to Increasing Strength

However, the open interest of NEAR rose by 19.44% to $320.97 million. It indicates that there is an increasing investment in derivative positions with continued participation in the market as investors maintain their positions and look forward to further changes in prices.

NEAR Derivative Data Point to Increasing Strength

Source: Coinglass

The trading volume increased by 63.82% to $538.80 million. This rise indicates that there is an increase in the number of people participating in trading activities. This suggests that liquidity and interest from investors have increased compared to previous levels.

This article contains market analysis and price predictions. These are not guarantees. Crypto markets are volatile. Always DYOR. Not financial advice.

Also Read: NEAR Protocol Price Strengthens With Long-Term Targets of $8, $17, and $50 in Focus

Filed Under: Cryptocurrency News

ALGO Price Prediction: Consolidation Phase Hints at Potential Rally to $0.15

By Sadia Ali | Edited By Ammar Raza,May 20, 2026, 5:30 AM

Algorand (ALGO) is showing signs of a potential recovery as selling pressure weakens and the ALGO price stabilizes at key support. Momentum is consolidating after a downtrend, with increasing trader participation and market activity suggesting growing confidence, while a breakout above resistance could confirm a broader bullish reversal.

At the time of writing, ALGO is trading at $0.1112 with a 24-hour trading volume of $42.9 million and a market capitalization of $993.41 million. After the 4.73% surge over the last 24 hours, the ALGO price could surge to new highs if the trend gains strength.

ALGO price chart

Source: CoinMarketCap

ALGO Forms Potential Reversal Pattern as Support Holds

According to the crypto analyst Jonathan Chiefrat, the ALGO price is showing early signs of a potential rounded bottom formation after an extended bearish phase. 

The ALGO price action is stabilizing with fewer lower lows, suggesting fading downside momentum. The $0.105–$0.11 zone has emerged as a strong demand area where buyers are actively defending structure.

ALGO Forms Potential Reversal Pattern as Support Holds

Source: Chiefrat’s X Post

In case this foundation stays strong, there may be a possibility that the bullish momentum will gradually move towards the falling trendline on a long-term basis. 

The first resistance for the ALGO price that needs to be overcome by the bulls is the level of $0.135. In case of its successful break, a move towards $0.15 may follow.

Also Read: Algorand (ALGO) Bullish Structure Points to Potential Breakout to $0.33

ALGO Technicals Point to a Consolidation Phase

According to TradingView, the ALGO price trend changed from a consistent macro downtrend to a volatile consolidation process. 

Following a flirtation with the lower Bollinger Band, a strong early April advance broke through the bearish momentum, sending the ALGO price above all critical EMAs. The strong break allowed for an uptrend in the new price range of $0.09000 to $0.13500.

ALGO Technicals Point to a Consolidation Phase

Source: TradingView

Having touched a high of $0.13500, the ALGO price dropped lower and broke below both the 20-day and 50-day EMAs. 

The current price action is trying to bounce back from the 100-day EMA support level of $0.11090. The bulls need to hold this crucial structure level for their bounce back to stay alive.

ALGO Derivative Data Point to Upward Potential

However, the open interest for ALGO increased by 5.22% to reach $47.72 million. This indicates that there is growing conviction in the market and also shows that the market has a stronger stance now since more funds have been committed through contracts.

ALGO Derivative Data Point to Upward Potential

Source: Coinglass

Trading volume increased by 45.81% to reach $80.14 million, indicating strong participation in the market and increased liquidity. This trend is indicative of higher trading activity and could indicate that there has been an increase in interest and volatility in the market for the asset.

This article contains market analysis and price predictions. These are not guarantees. Crypto markets are volatile. Always DYOR. Not financial advice.

Also Read: ALGO Could Surge To $0.26 After Japan’s Latest Regulatory Boost

Filed Under: Cryptocurrency News, Altcoin News

Dogecoin Price Signals Repeat Cycle Structure With $2 Long-Term Target in Focus

By Zagham Abbas | Edited By Ammar Raza,May 20, 2026, 5:00 AM

Dogecoin price action indicates the formation of a critical technical pattern as it undergoes a significant retest stage following its latest breakouts. Technical analysts are currently looking at how the latest pattern will be able to create a new uptrend cycle in line with previous occurrences. Meanwhile, a mixed market performance reflects a positive yet cautious trading scenario.

At press time, DOGE is trading at $0.1036, recording a slight 0.28% increased over the last 24 hours, according to CoinMarketCap. The token holds a market capitalization of about $17.57 billion, while daily trading volume stands close to $1.36 billion, reflecting consistent engagement even during short-term weakness.

Dogecoin price chart

Source: CoinMarketCap

Also Read |  Bitcoin Price Holds Strong Above $75K Despite Consecutive ETF Outflows

Dogecoin Price Outlook Shows Repeat Cycle Structure

A crypto analyst, Crypto Patel, noted on May 19, 2026, that DOGE had witnessed an exceptional rise of 26,834% during its previous cycle based on a similar technical pattern. According to Patel, the existing chart represents a recurring fractal-like pattern similar to the previous one.

This technical pattern consists of two breakout phases and a retest phase currently underway. Previous market cycles have shown that such a retest phase can be a critical turning point for the Dogecoin price.

Dogecoin Price Outlook Shows Repeat Cycle Structure

Source: Crypto Patel’s X Post

The accumulation area is spotted in the range of $0.07 to $0.09, and it is under scrutiny as a possible support region. In case of a confirmation of this formation, the technical analyst believes that the Dogecoin price can gain momentum towards higher ground.

Price objectives are set at $0.5, $1, and an extended target at $2, based on how strong the general market environment will be and demand levels. In case of a bearish invalidation of this formation, the price of $0.048 is important.

Market Data Signals Mixed but Active Conditions

Market movements reveal that there has been a change in market participation. The volume has decreased by 33.35% to approximately $2.22 billion, indicating low spot participation. Meanwhile, open interest has increased by 4.40% to approximately $1.44 billion, revealing that more people are trading in derivatives.

Market Data Signals Mixed but Active Conditions

Source: Coinglass

The open interest weighted funding rate stands at 0.0028%, indicating a relatively neutral market condition with a mild bullish bias. Neither bulls nor bears have taken control, and Dogecoin price remains in a balanced market state. The market conditions are rather volatile, with low spot trading volumes and steady derivative positions.

Market Data Signals Mixed but Active Conditions

Source: Coinglass

This article contains market analysis and price predictions. These are not guarantees. Crypto markets are volatile. Always DYOR. Not financial advice.

Also Read | Minnesota Approves Crypto Custody for Banks and Credit Unions

Filed Under: Cryptocurrency News, Altcoin News

Bitcoin Mining Crisis Deepens as Canaan Posts $88.7 Million Loss in Q1 2026

By Irene Maria | Edited By admin,May 20, 2026, 4:30 AM

Bitcoin mining hardware producer Canaan Inc. announced a significant loss for Q1 2026, as tough Bitcoin mining conditions and declining Bitcoin prices have greatly affected the bottom line. Mining revenue decline and weak demand for equipment led to a heavy quarterly loss for Canaan, along with a massive inventory impairment charge.

Canaan recorded a net loss of $88.7 million for the quarter that ended on March 31. The revenue fell sharply to $62.7 million compared to $196.3 million recorded in the previous quarter, reflecting the rapid impact that the downturn in Bitcoin mining has had on its operations.

Bitcoin mining has had on its operations.

Source: Canaan

Also Read | Tether and LemFi Partnership Increases Stablecoin Adoption in Cross-Border Payments

Bitcoin Mining Revenue Decline Hits Canaan Results

The mining equipment industry for the company accounted for earnings of $39.6 million; however, this was the segment that recorded the largest fall, falling by 75% compared to the previous quarter. Earnings from self-mining stood at $19.1 million while those from home mining were $2.7 million.

As per Canaan, despite the fall in both the cost and reward associated with mining Bitcoin, there was no substantial reduction in Bitcoin mining due to consistent activities and improved computing power.

But even then, there was an inventory write-down of $25 million for the period. This resulted in a net loss of $23 million and operational losses of $54.3 million. These numbers clearly depict the difficulties that the Bitcoin mining industry is facing.

Even though the performance is poor, Canaan has managed to boost its mining power for Bitcoin. The hash rate for self-mining by the firm rose from 6.6 EH/s to 11 EH/s in one year. Furthermore, Canaan had 1,808 BTC on its balance sheet valued at $121 million.

The company also made an important acquisition of shares of Cipher Mining held in joint ventures located in West Texas. This gave the company extra mining capacity, along with lower power costs. The facilities have the benefit of a power cost of less than three cents per kilowatt hour.

The Outlook is Still Poor for the Mining Industry

Second-quarter revenue for Canaan is expected to drop further to between $35 million and $45 million, indicating continued challenges within the Bitcoin mining industry. The stock price of Canaan fell 3.54% to close at $0.4827 on Monday, while it shed an additional 7.71% in the pre-market session to trade at $0.4455, according to Yahoo Finance.

Other major companies within Bitcoin mining include Riot Platforms, Core Scientific, CleanSpark, and TeraWulf, all of which have recorded greater losses during the same period.

The mining company MARA Holdings recorded a $1.3 billion loss largely due to non-cash valuation impacts on its Bitcoin investments, demonstrating how unpredictable the Bitcoin mining industry has become.

Meanwhile, there are firms that have decided to invest in artificial intelligence and high-performance computing. The HIVE Digital Technologies firm, for example, is already planning on building an AI data center, which shows that firms are looking to reduce risk outside of Bitcoin mining.

Also Read | Polkadot (DOT) Price Forecast: Bulls Aim for $1.40 After Recent Pullback

Filed Under: Cryptocurrency News

NVIDIA Price Signals Potential Rebound After TD Sequential Buy Trigger Near $230 Zone

By Zagham Abbas | Edited By Ammar Raza,May 20, 2026, 4:00 AM

NVIDIA price is expected to bounce back after a new TD Sequential buy signal was triggered on NVIDIA shares. The pullback happened after the stock failed to break above the key resistance area. However, from the technical point of view, it is obvious that buying interest continues to show. We will see if the price of NVIDIA shares will bounce back to $230.

At the time of writing, the NVDA price is trading at $218.6, recording a 1.54% decline over the last 24 hours. Daily trading volume reached $7.06 billion, while the company maintained a market capitalization of $5.29 trillion. Despite the short-term pullback, the NVIDIA price continues to trade above key support zones, keeping hopes alive for another upward move if buying activity returns.

NVDA price chart

Source: CoinMarketCap

Also Read | ADA Price Analysis: Elliott Wave Pattern Suggests Recovery Target at $0.349

NVIDIA Price Holds Bullish Structure

As per the statement made by crypto analyst Ali Martinez on May 19, 2026, the TD Sequential of NVIDIA registered a new buy signal after its slight retracement. This is because the indicator frequently marks the end of retracements, particularly after rallies, in the case of stocks having solid fundamentals.

NVIDIA Price Holds Bullish Structure

Source: Ali Martinez’s X Post

The last correction occurred when the NVIDIA price broke through the $230 level and attracted the sellers, who forced a decline in prices. Despite the recent fall, a lot of investors still consider the overall trend to be bullish since NVIDIA stock is holding above key support levels. The traders are waiting for the current support level to be broken, and then the next breakout may follow.

NVIDIA Price Pulls Back After Strong Rally

The share price for NVIDIA had risen to surpass the $230 level but saw selling pressure mount as the price fell back towards the $218 level. It implies that there is no more bullish pressure on the price now.

The technical indicators indicate that the buying pressure is still strong in the market. The RSI indicator for NVIDIA is currently trading at 57.98 compared to its previous value of 62.28. The RSI is showing cooling, but is still above the critical 50 level.

NVIDIA Price Pulls Back After Strong Rally

Source: TradingView

The Moving Average Convergence Divergence (MACD) is another technical analysis tool that confirms the bullish forecast regarding the price of NVIDIA. The MACD line is above the signal line, standing at 8.43 and 7.92, respectively. The histogram is also positive, at 0.50.

The above formation shows that there is still bullish momentum, but the gap between the two lines is narrowing. If more selling pressure is added to the market, the price of NVIDIA may fall again before making any attempt to rise.

Currently, all eyes are on whether NVIDIA’s price will be able to maintain its current support zone and build sufficient strength to make an attempt at breaking the $230 resistance zone.

This article contains market analysis and price predictions. These are not guarantees. Crypto markets are volatile. Always DYOR. Not financial advice.

Also Read | XRP Price Analysis: Will a Breakout Above $1.50 Trigger a Rally?

Filed Under: Cryptocurrency News, Altcoin News

TIA Price Prediction: Can Bulls Push the Rally to $3.90 After Recovery Signs?

By Sadia Ali | Edited By Ammar Raza,May 20, 2026, 3:30 AM

Celestia (TIA) is showing recovery signs as momentum strengthens near a breakout zone. RSI and MACD indicate fading selling pressure, while trading volume has surged sharply. Analysts expect a potential bullish rally for the TIA price if buying pressure continues increasing in upcoming sessions.

At the time of writing, TIA is trading at $0.3919 with a 24-hour trading volume of $31.34 million and a market capitalization of $360.19 million. Following the 2.07% surge over the last 24 hours, the TIA price seems to be poised for a trend reversal supported by rising volume and momentum indicators.

TIA price chart

Source: CoinMarketCap

Also Read: Celestia Price Outlook: TIA Price Breakout Targets a Potential 300–400% Rally

TIA Price Setup Signals Strong Upside Potential

Furthermore, the crypto analyst Jonathan Carter highlighted that the TIA price is showing strong signs of recovery as the token consolidates near the upper boundary of a descending channel on the 3-day timeframe. 

Analysts note that the MA 50 continues to provide solid support, while momentum builds around a potential breakout zone. Traders have already secured nearly 35% profit from previous positions recently.

TIA Price Setup Signals Strong Upside Potential

Source: Jonathan Carter’s X Post

According to market analysts, the breakout will most likely create an extremely bullish rally for the TIA price in the short term. 

The next major recovery levels for the TIA price should be around $0.60, $0.90, $1.33, $2.35, and $3.90 if the buying pressure continues to increase. Given the increasing volume and narrowing prices, Celestia is likely to make a big move higher soon.

Technical Indicators Point to Decreasing Pressure

According to TradingView, RSI is positioned in neutral territory at 42.86. Having fallen close to the oversold level at around 30 on May 18 to indicate that sellers were exhausted, it has rallied and breached its signal level at 37.18.

This TIA price recovery suggests that bullish sentiment could be taking root, even though it remains below the 50 level.

TIA Technical Indicators Point to Decreasing Pressure

Source: TradingView

Despite being in negative territory, the MACD is showing a bullish crossover, where the blue line moves above the orange line, standing at -0.00904 and -0.01156, respectively. 

This is reflected in the histogram through green bars as selling pressure decreases. However, remaining under zero makes sure that the general trend remains bearish.

Rising Trading Volume Points to Bullish Breakout Ahead

However, TIA trading volume rose to 89.59% to reach $189.66 million, indicating increased trading activities and participation of more investors. This increment indicates growing interest among traders, possibly due to the recent movements in the TIA price, changes in sentiments in the market, or other events that may affect trading.

Rising Trading Volume Points to Bullish Breakout Ahead

Source: Coinglass

Meanwhile, open interest fell by 3.41% to $55.15 million, suggesting that there may be fewer active derivative contracts. This fall could mean that traders have closed their positions or are less speculative, even though there is an increase in trading volumes.

This article contains market analysis and price predictions. These are not guarantees. Crypto markets are volatile. Always DYOR. Not financial advice.

Also Read: Celestia Price Prediction: TIA Price Breakout Signals a Rally Toward $2.70

Filed Under: Cryptocurrency News, Altcoin News

  • « Go to Previous Page
  • Page 1
  • Interim pages omitted …
  • Page 56
  • Page 57
  • Page 58
  • Page 59
  • Page 60
  • Interim pages omitted …
  • Page 3666
  • Go to Next Page »

Primary Sidebar

Recent Posts

  • ALGO Price Forecast: Can it Break Above $0.1319 Resistance? June 6, 2026
  • XRP Price Struggles at $1 Support While Bullish Cycle Targets Stay Locked at $5, $10 June 6, 2026
  • Galaxy Research Warns CLARITY Act Could Face Major Delays in 2026 June 6, 2026
  • Binance Coin Price Holds $570 as Resistance Triggers Market Uncertainty June 6, 2026
  • Professional Bitcoin Holdings Fall 17% as Hedge Funds Exit Positions June 6, 2026

Footer

News

  • Latest News
  • Altcoin News
  • Bitcoin (BTC)
  • Blockchain
  • Tron (TRX)
  • World

Digest

  • Meet the Founder
  • Price Winning Article
  • DeFi
  • Cyber Security
  • Crypto Scam

Industry

  • Project Review
  • Technology
  • Fintech
  • Tron Exchange
  • New in Town

Tron Universe

  • Event and Tron Parties
  • New in Town
  • Tron Tokens

FOLLOW US

  • Facebook
  • Telegram
  • Twitter
  • Linkedin

Subscribe US

Editorial Policy | Privacy Policy | Disclaimer | Terms and Conditions | Masthead

Copyright © 2026 · Tron Weekly. All Rights Reserved. NOTE: Tron Weekly is an independent crypto news site that adheres to the strict journalism policy anchored on transparency, trust, and objectivity, we have no affiliation with the TRON Foundation, its founder Justin Sun or any other cryptocurrency firm.